**NOTE: NOW FEATURING POST-AUCTION ANALYSIS.**
(Clock Auction Analysis Now Found Below Post-Auction Analysis)
(Please use Chrome Browser for best experience.)
(Clock Auction Analysis Now Found Below Post-Auction Analysis)
(Please use Chrome Browser for best experience.)
POST-AUCTION ANALYSIS FOR AUCTION 107 (3700-3980 MHz Band)
**Note: License categories are based on clock stage categories for sake of consistency.**
Please Select a Round to Display Network Graph
20 Most Expensive Products by Price Per MHz-POP after Round 97: (any category)
Tracking Auction 107's Progress Toward Completion after Round 97:
Comparing Auction 107's Progress to Prior FCC Auctions after Round 97:
BONUS VIDEO: Review Round-by-Round Bidding with Video Showing Change in Demand for Round 1 through Round 97:
BONUS VIDEO 2 : Review Round-by-Round Bidding with Video Showing in 3D Gross Proceeds for Round 1 through Round 97:
Total Proceeds at End of Assignment Stage:
| Gross Proceeds | Net Proceeds | |
| All Categories: | $81,168,677,645 | $81,114,481,921 |
| Category A: | $23,257,851,922 | $23,257,851,922 |
| Category BC: | $37,847,048,991 | $37,847,048,991 |
| Category ABC: | $20,063,776,732 | $20,009,581,008 |
Nationwide Price Per MHz-POP Statistics at End of Assignment Stage:
| Net Price Per MHz-POP | Fully-Loaded Net Price Per MHz-POP (1) | |
| Average Across All Categories: | $0.944631 | $1.096024 |
| Category A: | $1.312893 | $1.619281 |
| Category BC: | $1.186914 | $1.342050 |
| Category ABC: | $0.551728 | $0.624122 |
(1) Fully-Loaded Prices include an estimated $9.7 B in accelerated clearing payments and $3.3 B in relocation costs.
POST-AUCTION ANALYSIS: Breakdown of Winning Bidders Across All Blocks and A Blocks
POST-AUCTION ANALYSIS: Bidder Summary(2)
| Bidder | # of Markets Covered | # of Licenses Won | Ave. Depth | Weighted Ave. Depth | Pops Covered | % of CONUS Covered | Net Payments | $/MHz-POP | FULLY-LOADED $/MHz-POP |
|---|---|---|---|---|---|---|---|---|---|
| Cellco Partnership | 406 | 3,511 | 8.65 | 8.05 | 306,675,006 | 100.00% | $45,454,843,197 | $0.921088 | $1.070411 |
| AT&T Spectrum Frontiers LLC | 406 | 1,621 | 3.99 | 3.99 | 306,675,006 | 100.00% | $23,406,860,839 | $0.955422 | $1.119532 |
| T-Mobile License LLC | 72 | 142 | 1.97 | 1.99 | 207,704,778 | 67.73% | $9,336,125,147 | $1.131190 | $1.279169 |
| United States Cellular Corporation | 99 | 254 | 2.57 | 2.54 | 30,966,188 | 10.10% | $1,282,641,542 | $0.815102 | $0.921776 |
| NewLevel II, L.P. | 10 | 10 | 1.00 | 1.00 | 55,082,417 | 17.96% | $1,277,395,688 | $1.159531 | $1.311535 |
| Canopy Spectrum, LLC | 43 | 84 | 1.95 | 1.92 | 18,465,137 | 6.02% | $172,021,760 | $0.243157 | $0.279680 |
| Cellular South Licenses, LLC | 4 | 8 | 2.00 | 2.00 | 2,006,233 | 0.65% | $49,850,284 | $0.621193 | $0.702659 |
| Widespread Wireless, LLC | 7 | 14 | 2.00 | 2.00 | 4,001,453 | 1.30% | $48,455,001 | $0.302734 | $0.355670 |
| Pioneer Telephone Cooperative, Inc. | 2 | 4 | 2.00 | 2.00 | 286,375 | 0.09% | $20,104,200 | $1.755059 | $2.025845 |
| Carolina West Wireless, Inc. | 4 | 7 | 1.75 | 1.84 | 867,064 | 0.28% | $15,780,658 | $0.495899 | $0.572411 |
| Nex-Tech Wireless, L.L.C. | 5 | 5 | 1.00 | 1.00 | 762,494 | 0.25% | $10,339,437 | $0.678001 | $0.782553 |
| East Kentucky Network, LLC | 1 | 1 | 1.00 | 1.00 | 620,049 | 0.20% | $7,374,390 | $0.594662 | $0.686412 |
| Horry Telephone Cooperative, Inc. | 2 | 3 | 1.50 | 1.89 | 443,600 | 0.14% | $6,492,586 | $0.387306 | $0.447063 |
| Smith Bagley, Inc. | 3 | 4 | 1.33 | 1.42 | 407,716 | 0.13% | $5,640,183 | $0.487957 | $0.563236 |
| Nsight Spectrum, LLC | 2 | 3 | 1.50 | 1.39 | 552,032 | 0.18% | $5,424,123 | $0.353044 | $0.399344 |
| LICT Wireless Broadband Company, LLC | 5 | 5 | 1.00 | 1.00 | 425,866 | 0.14% | $4,267,485 | $0.501036 | $0.566745 |
| Agri-Valley Communications, Inc. | 2 | 2 | 1.00 | 1.00 | 511,902 | 0.17% | $4,178,141 | $0.408100 | $0.471065 |
| Union Telephone Company | 1 | 2 | 2.00 | 2.00 | 125,434 | 0.04% | $2,655,060 | $0.529175 | $0.610820 |
| Little Bear Wireless L.L.C. | 1 | 1 | 1.00 | 1.00 | 213,445 | 0.07% | $2,510,020 | $0.587978 | $0.665089 |
| Grand River Communications, Inc. | 1 | 2 | 2.00 | 2.00 | 37,191 | 0.01% | $1,351,670 | $0.908600 | $1.048787 |
| Granite Wireless LLC | 1 | 1 | 1.00 | 1.00 | 21,294 | 0.01% | $170,510 | $0.400371 | $0.452878 |
(2) As noted above, Fully-Loaded Prices include an estimated $9.7 B in accelerated clearing payments and $3.3 B in relocation costs.
The Price per MHz-POP calculations use net payments in the numerator.
Also, for those not familiar with these bidding entities, "Cellco Partnership" is Verizon and "Little Bear Wireless L.L.C" is DISH. NewLevel II, L.P. and Canopy Spectrum, LLC are backed by private equity firms.
The Price per MHz-POP calculations use net payments in the numerator.
Also, for those not familiar with these bidding entities, "Cellco Partnership" is Verizon and "Little Bear Wireless L.L.C" is DISH. NewLevel II, L.P. and Canopy Spectrum, LLC are backed by private equity firms.
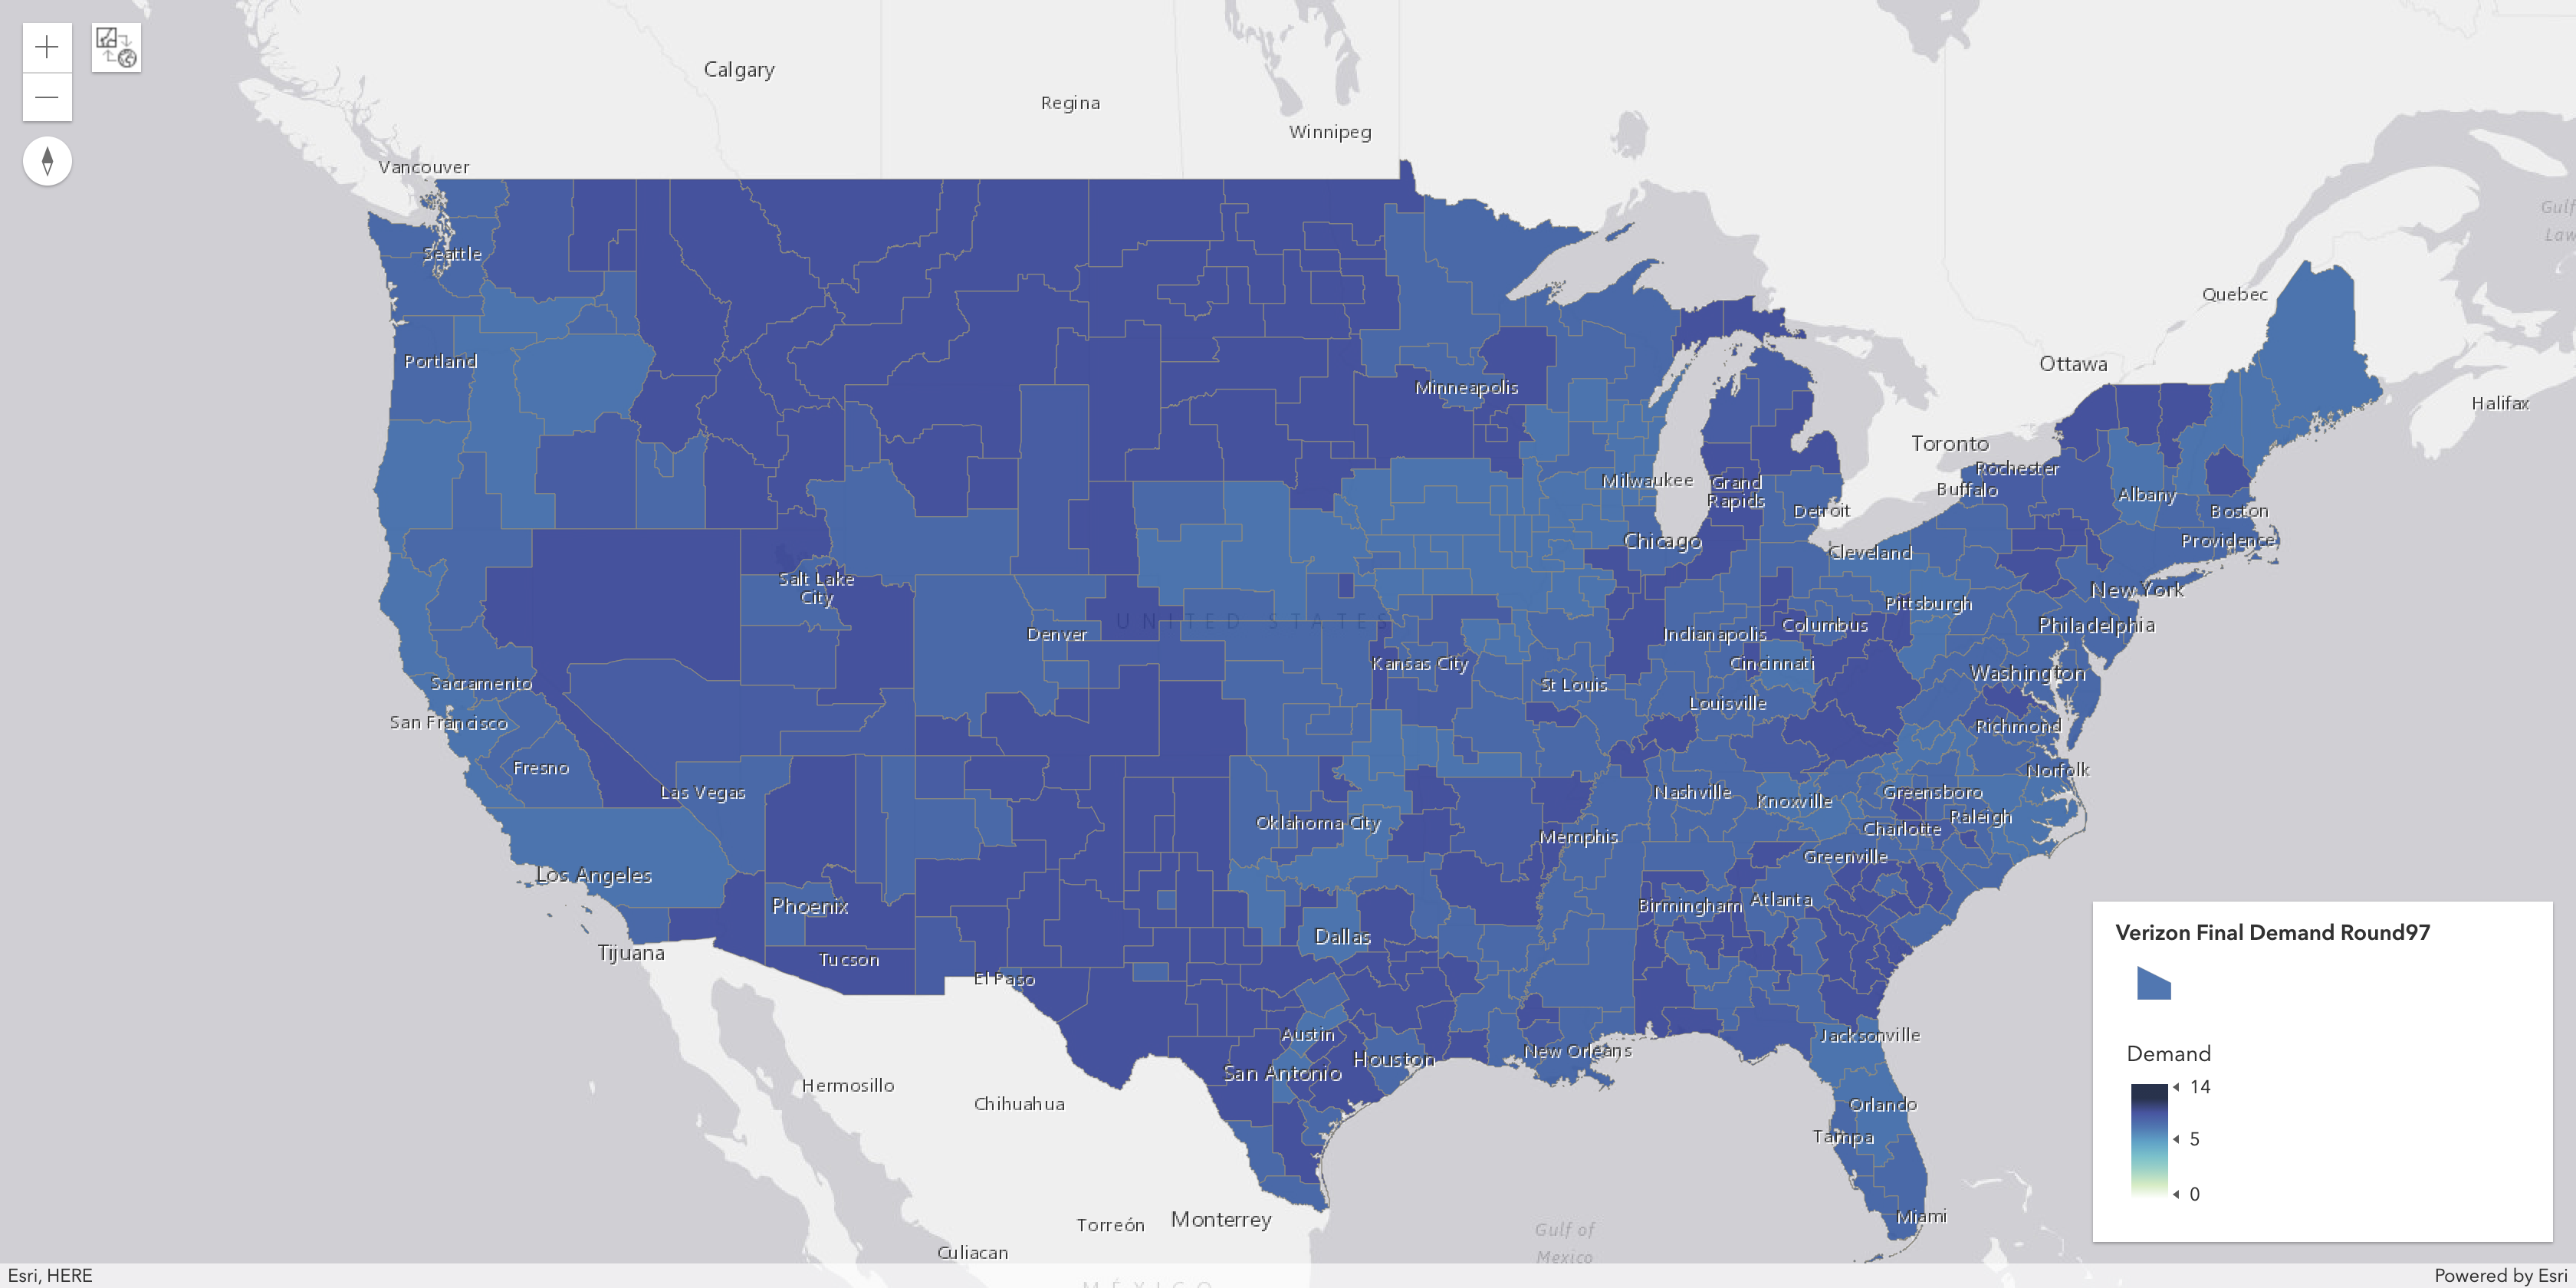
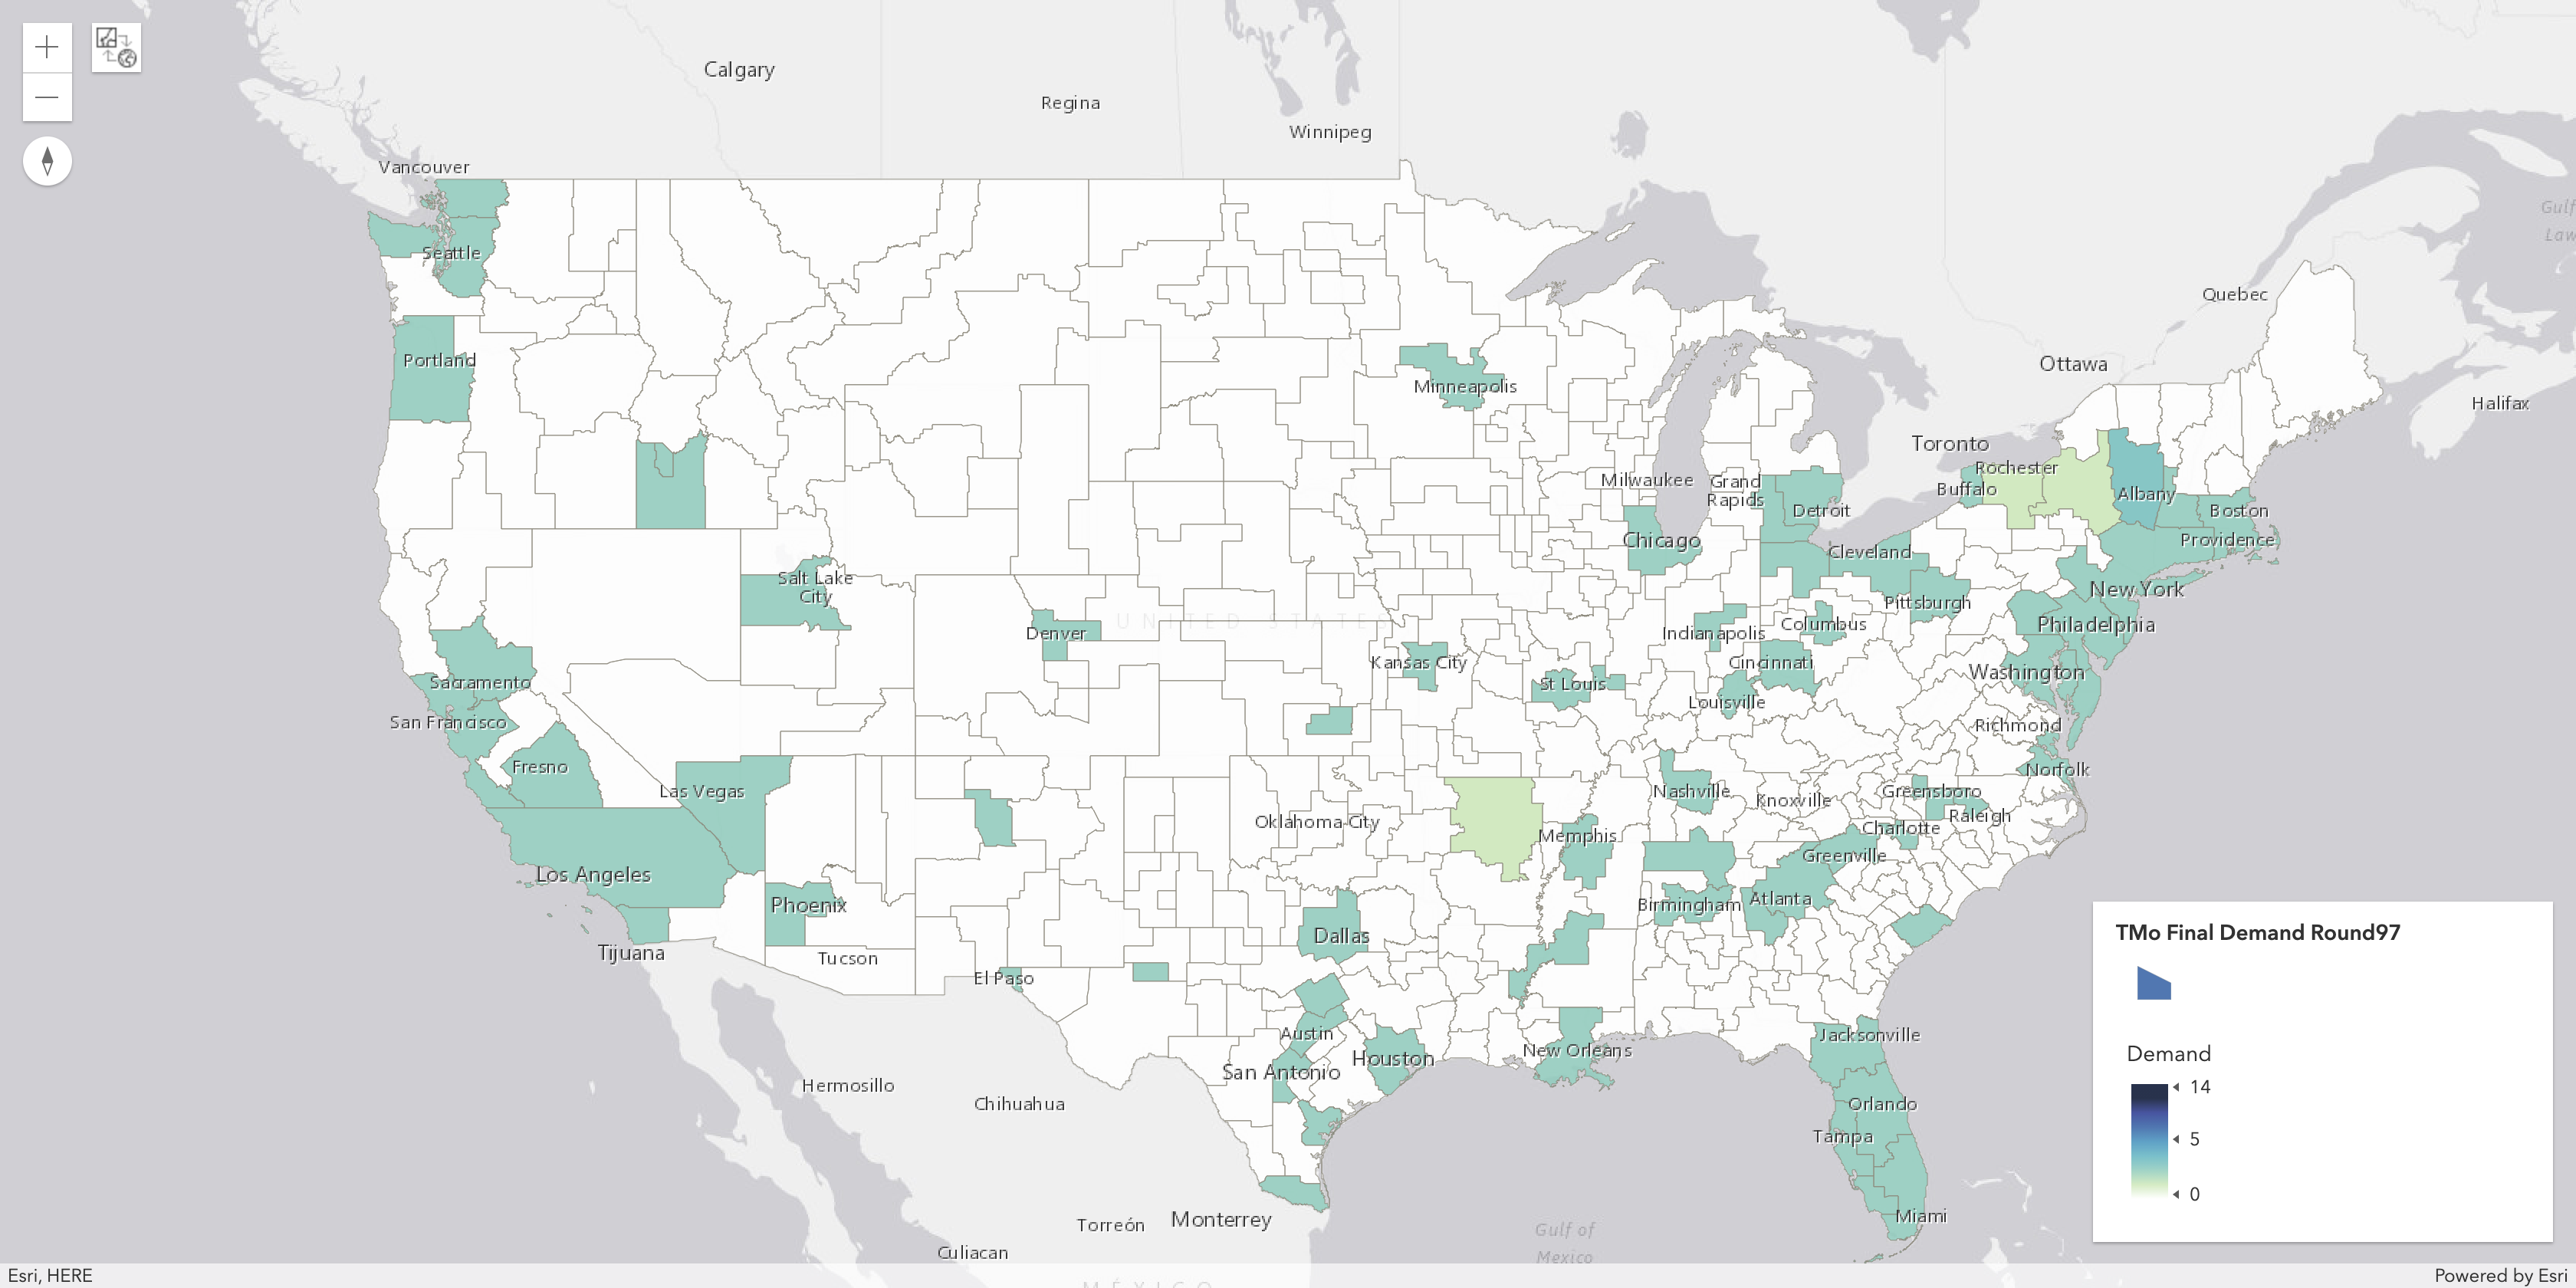
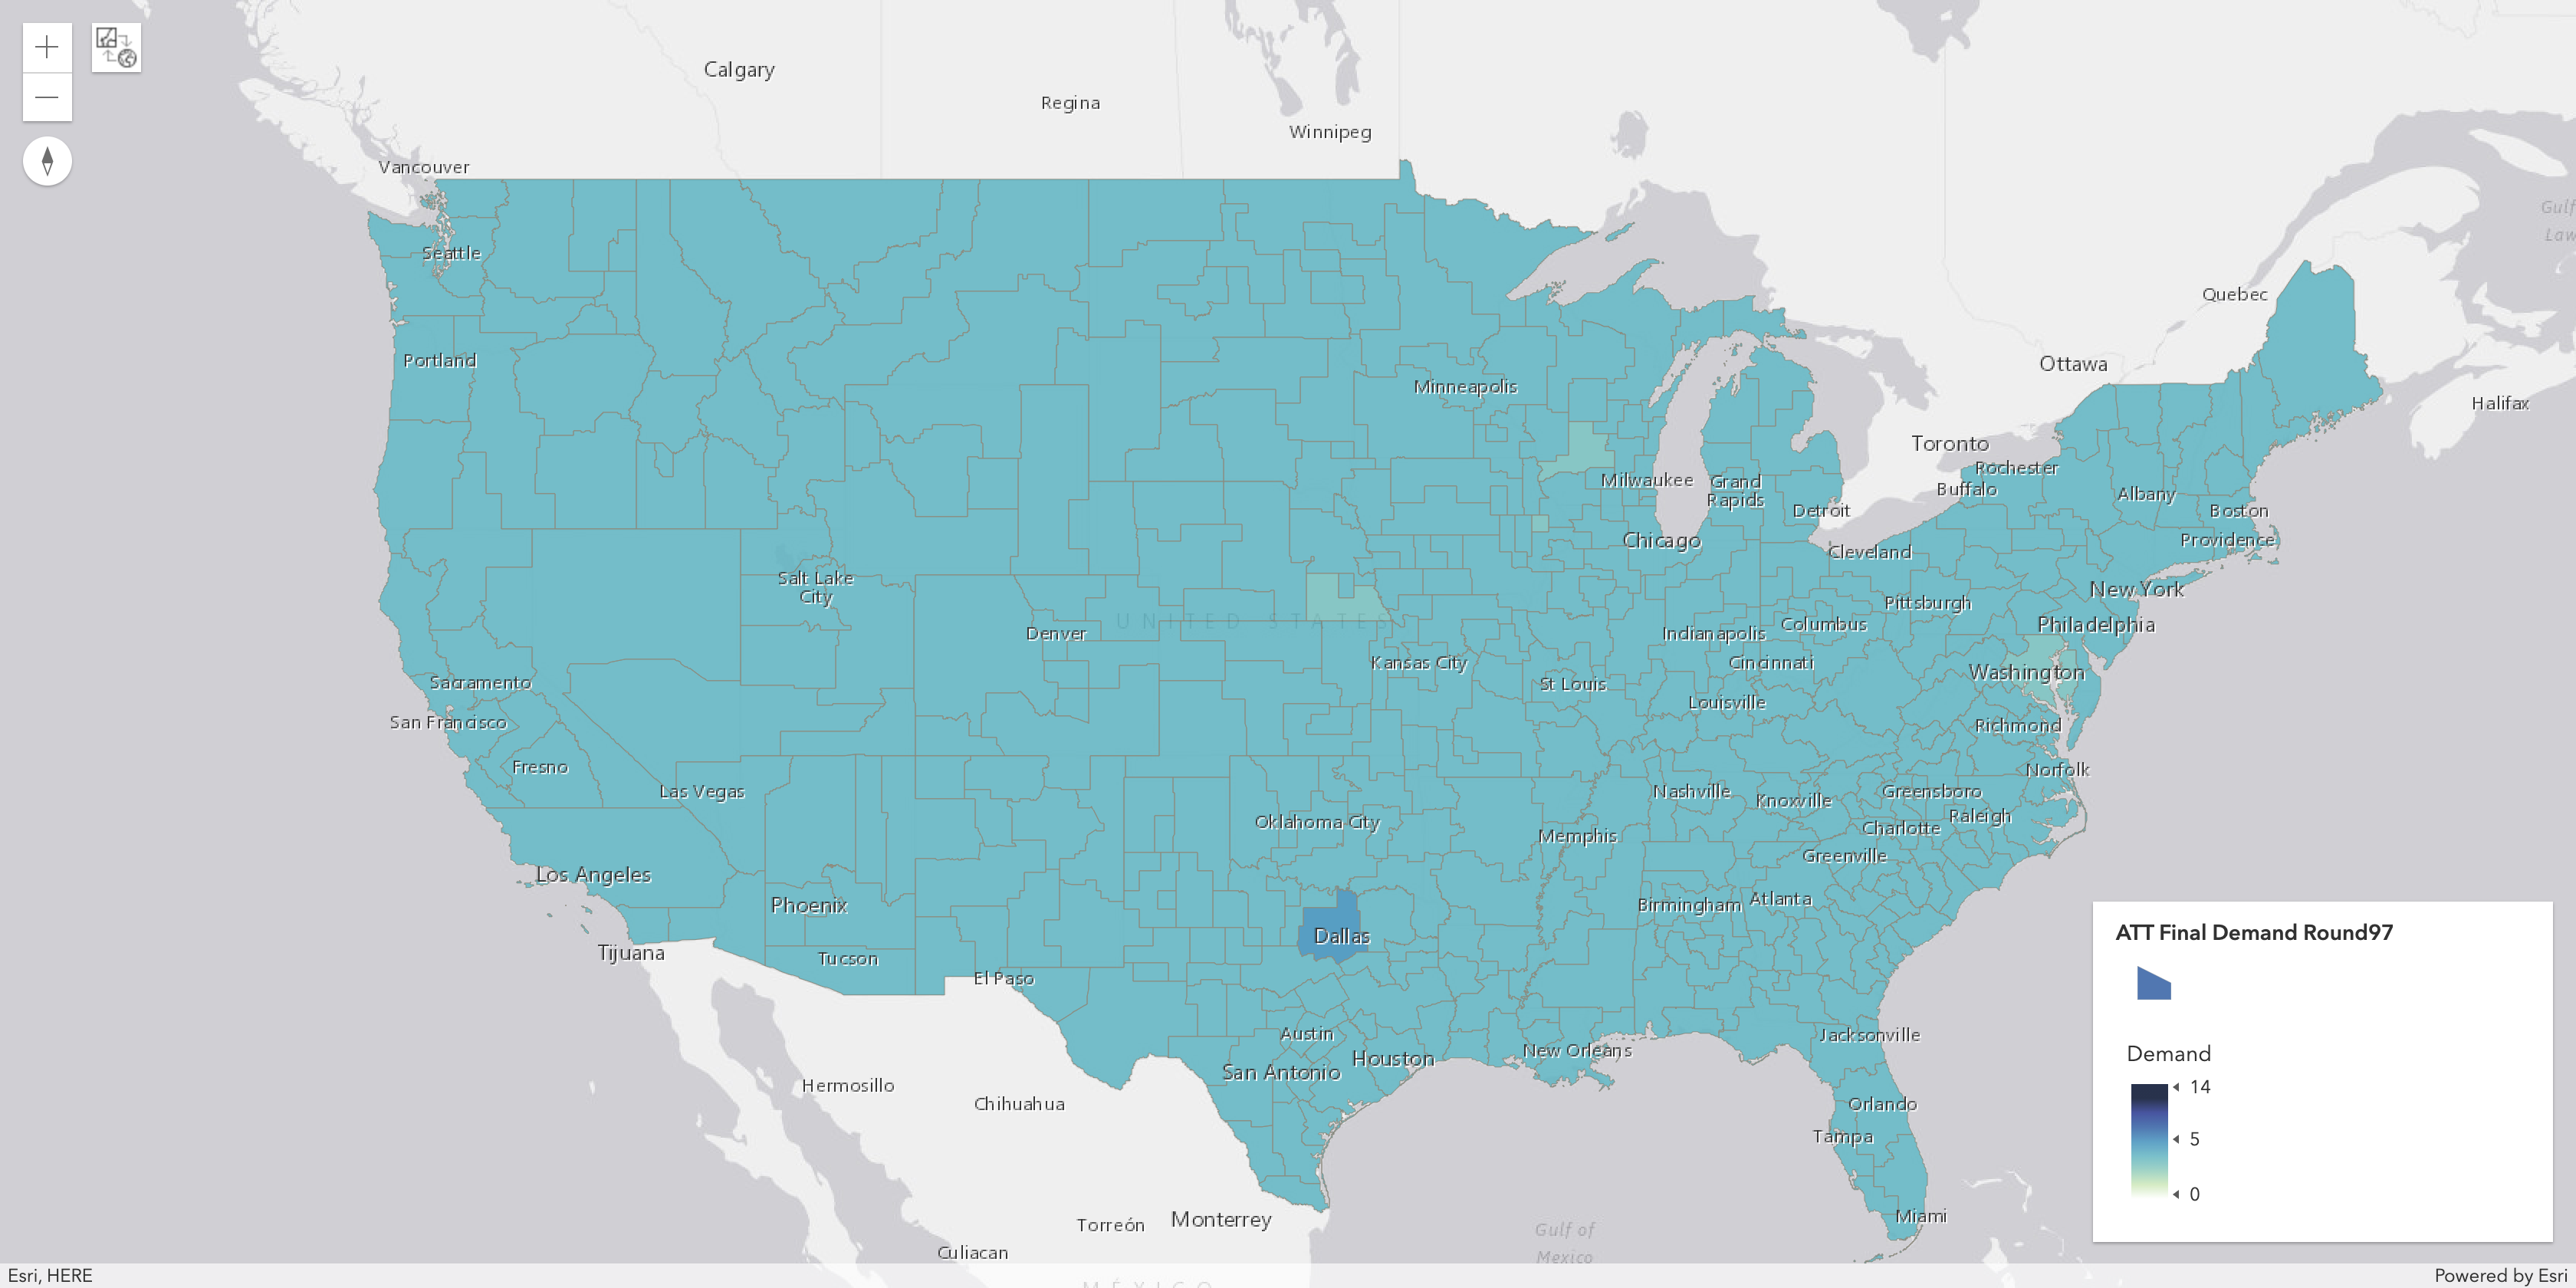
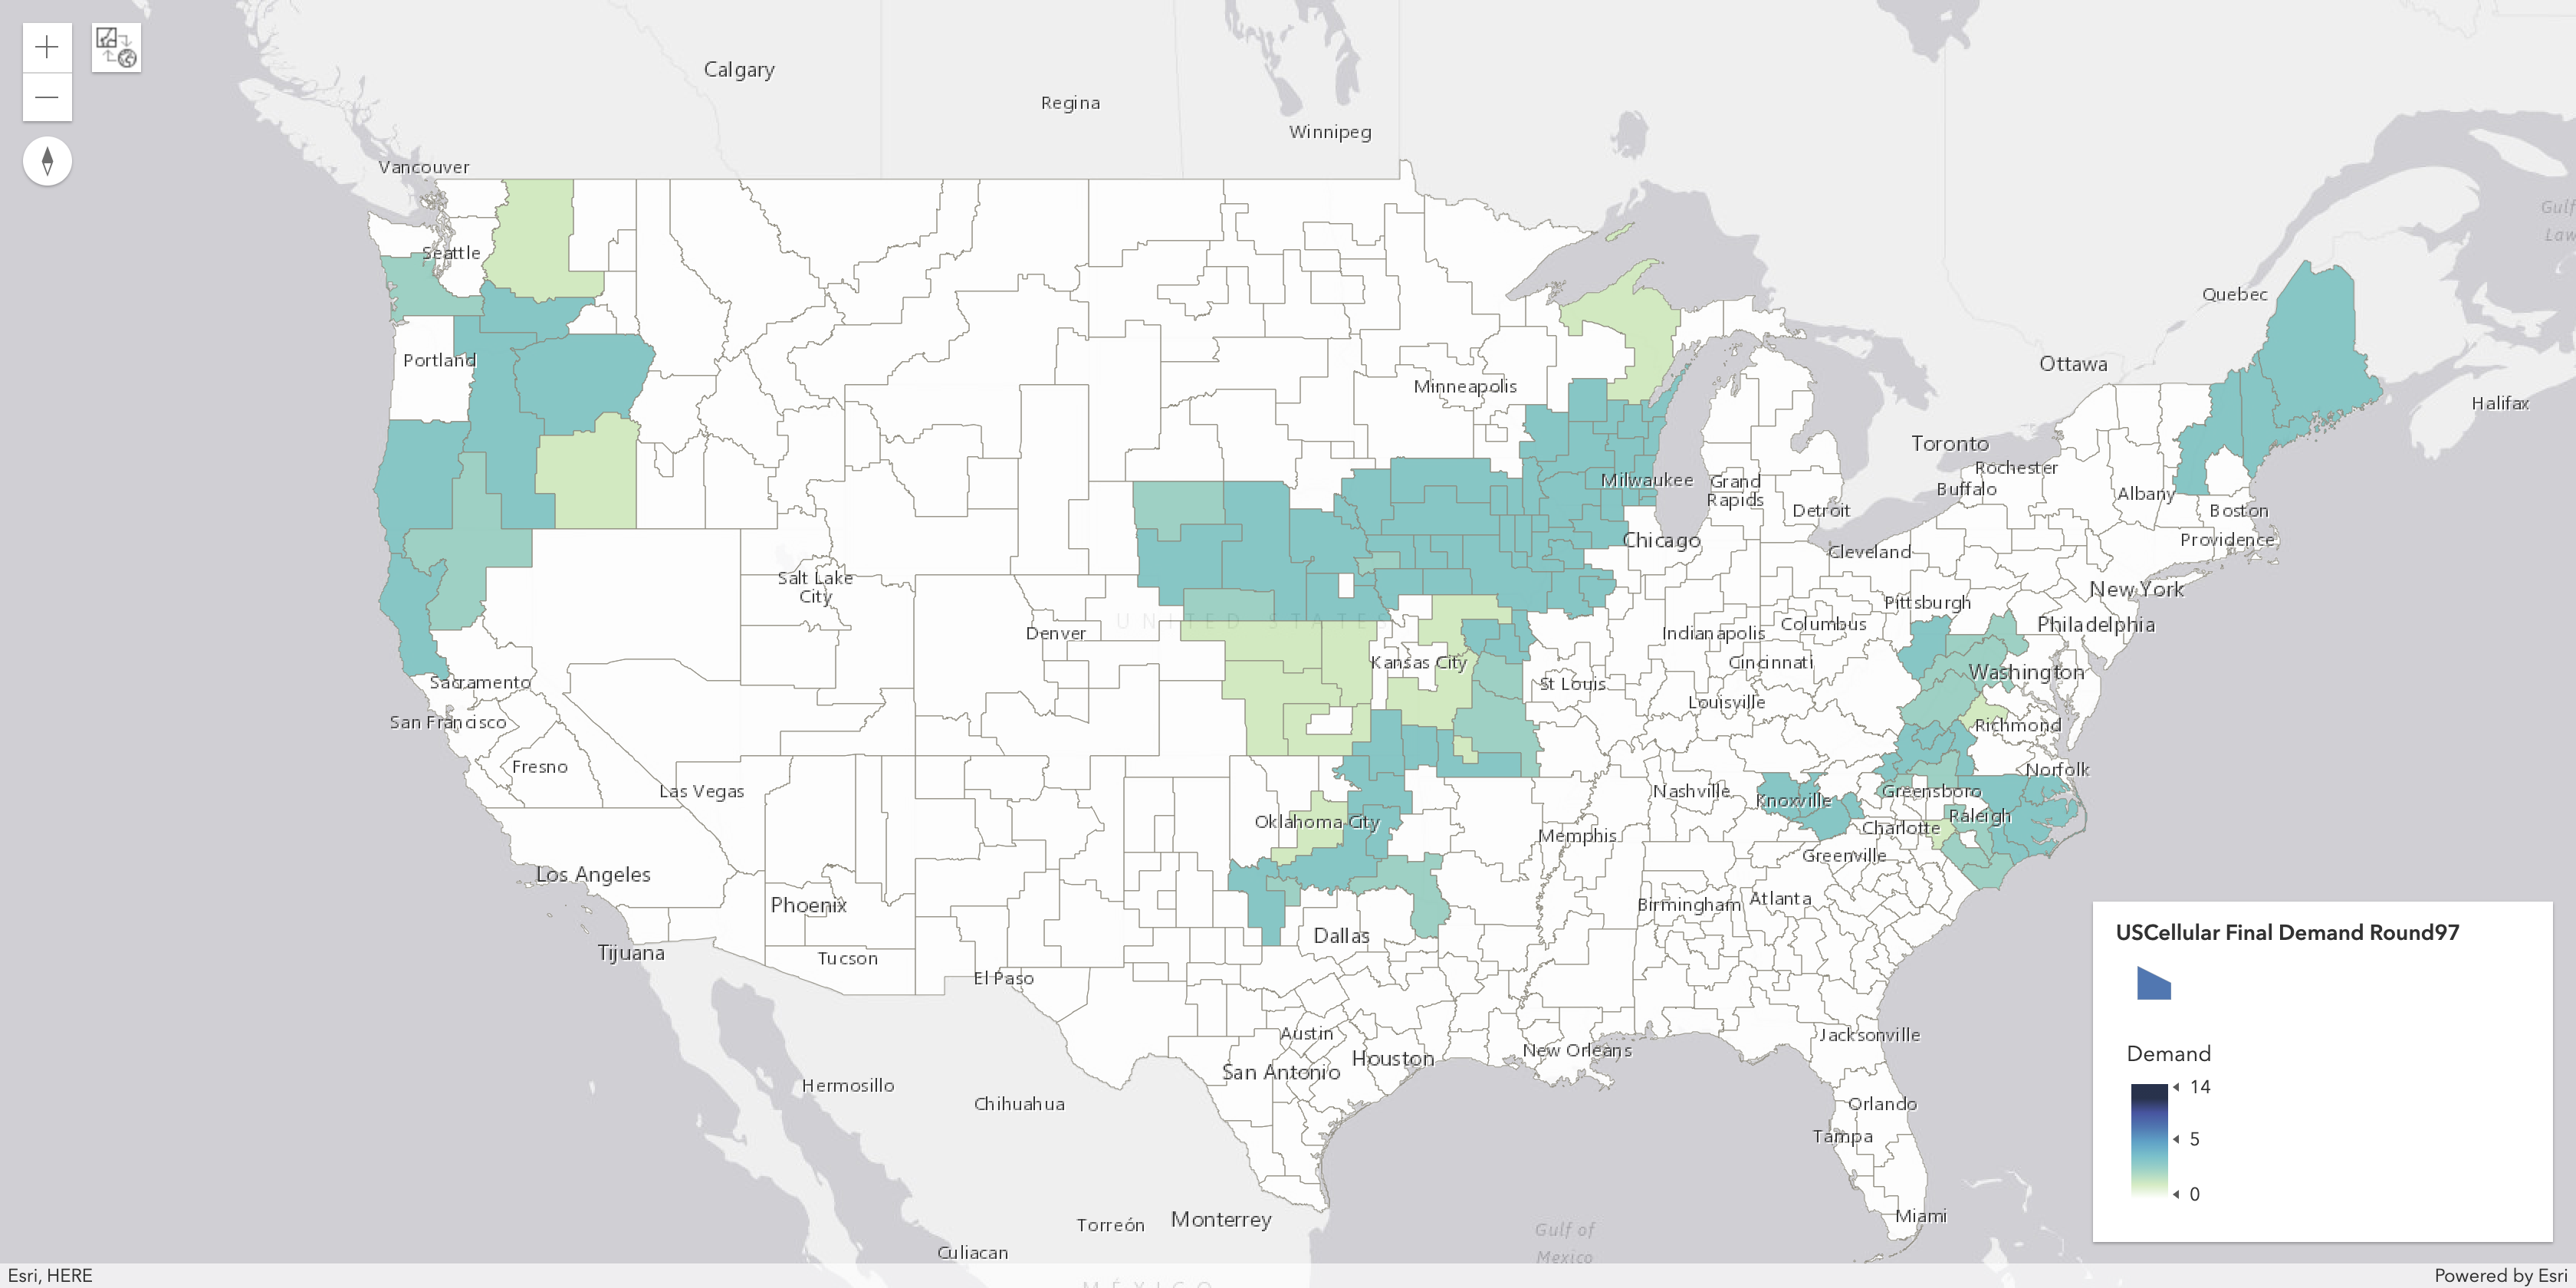
POST-AUCTION ANALYSIS: Maps of Licenses Won By Key Bidders
Verizon Licenses Won (All Categories)

T-Mobile Licenses Won (All Categories)

AT&T Licenses Won (All Categories)

US Cellular Licenses Won (All Categories)

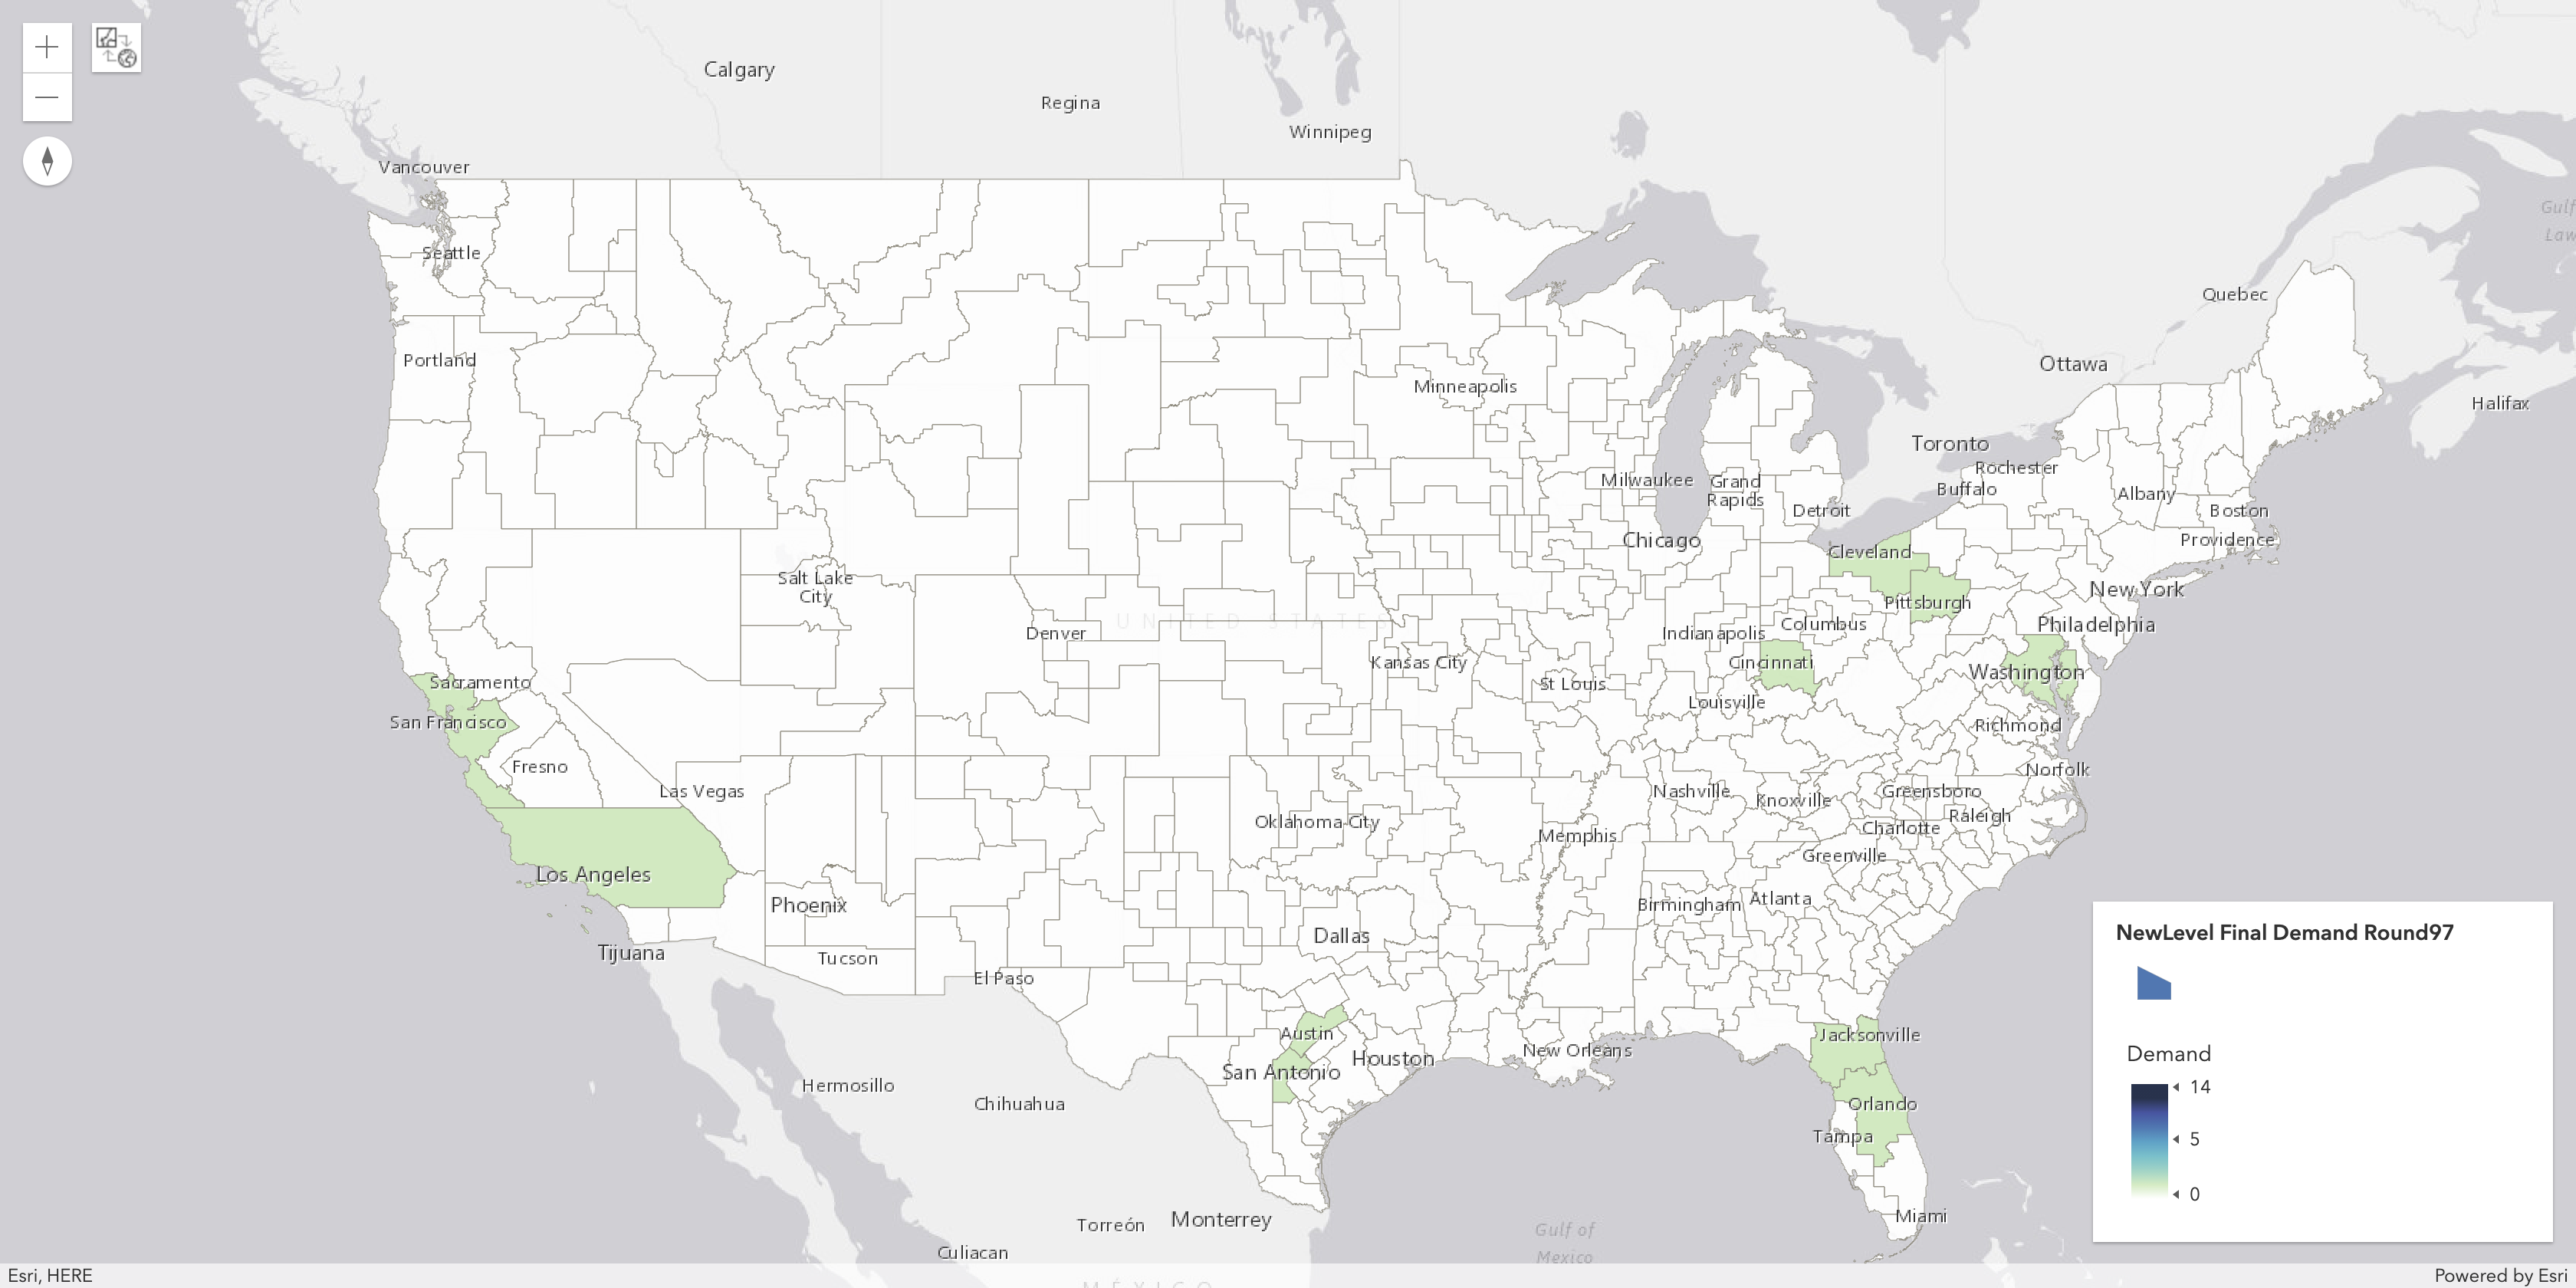
NewLevel II Licenses Won (All Categories)

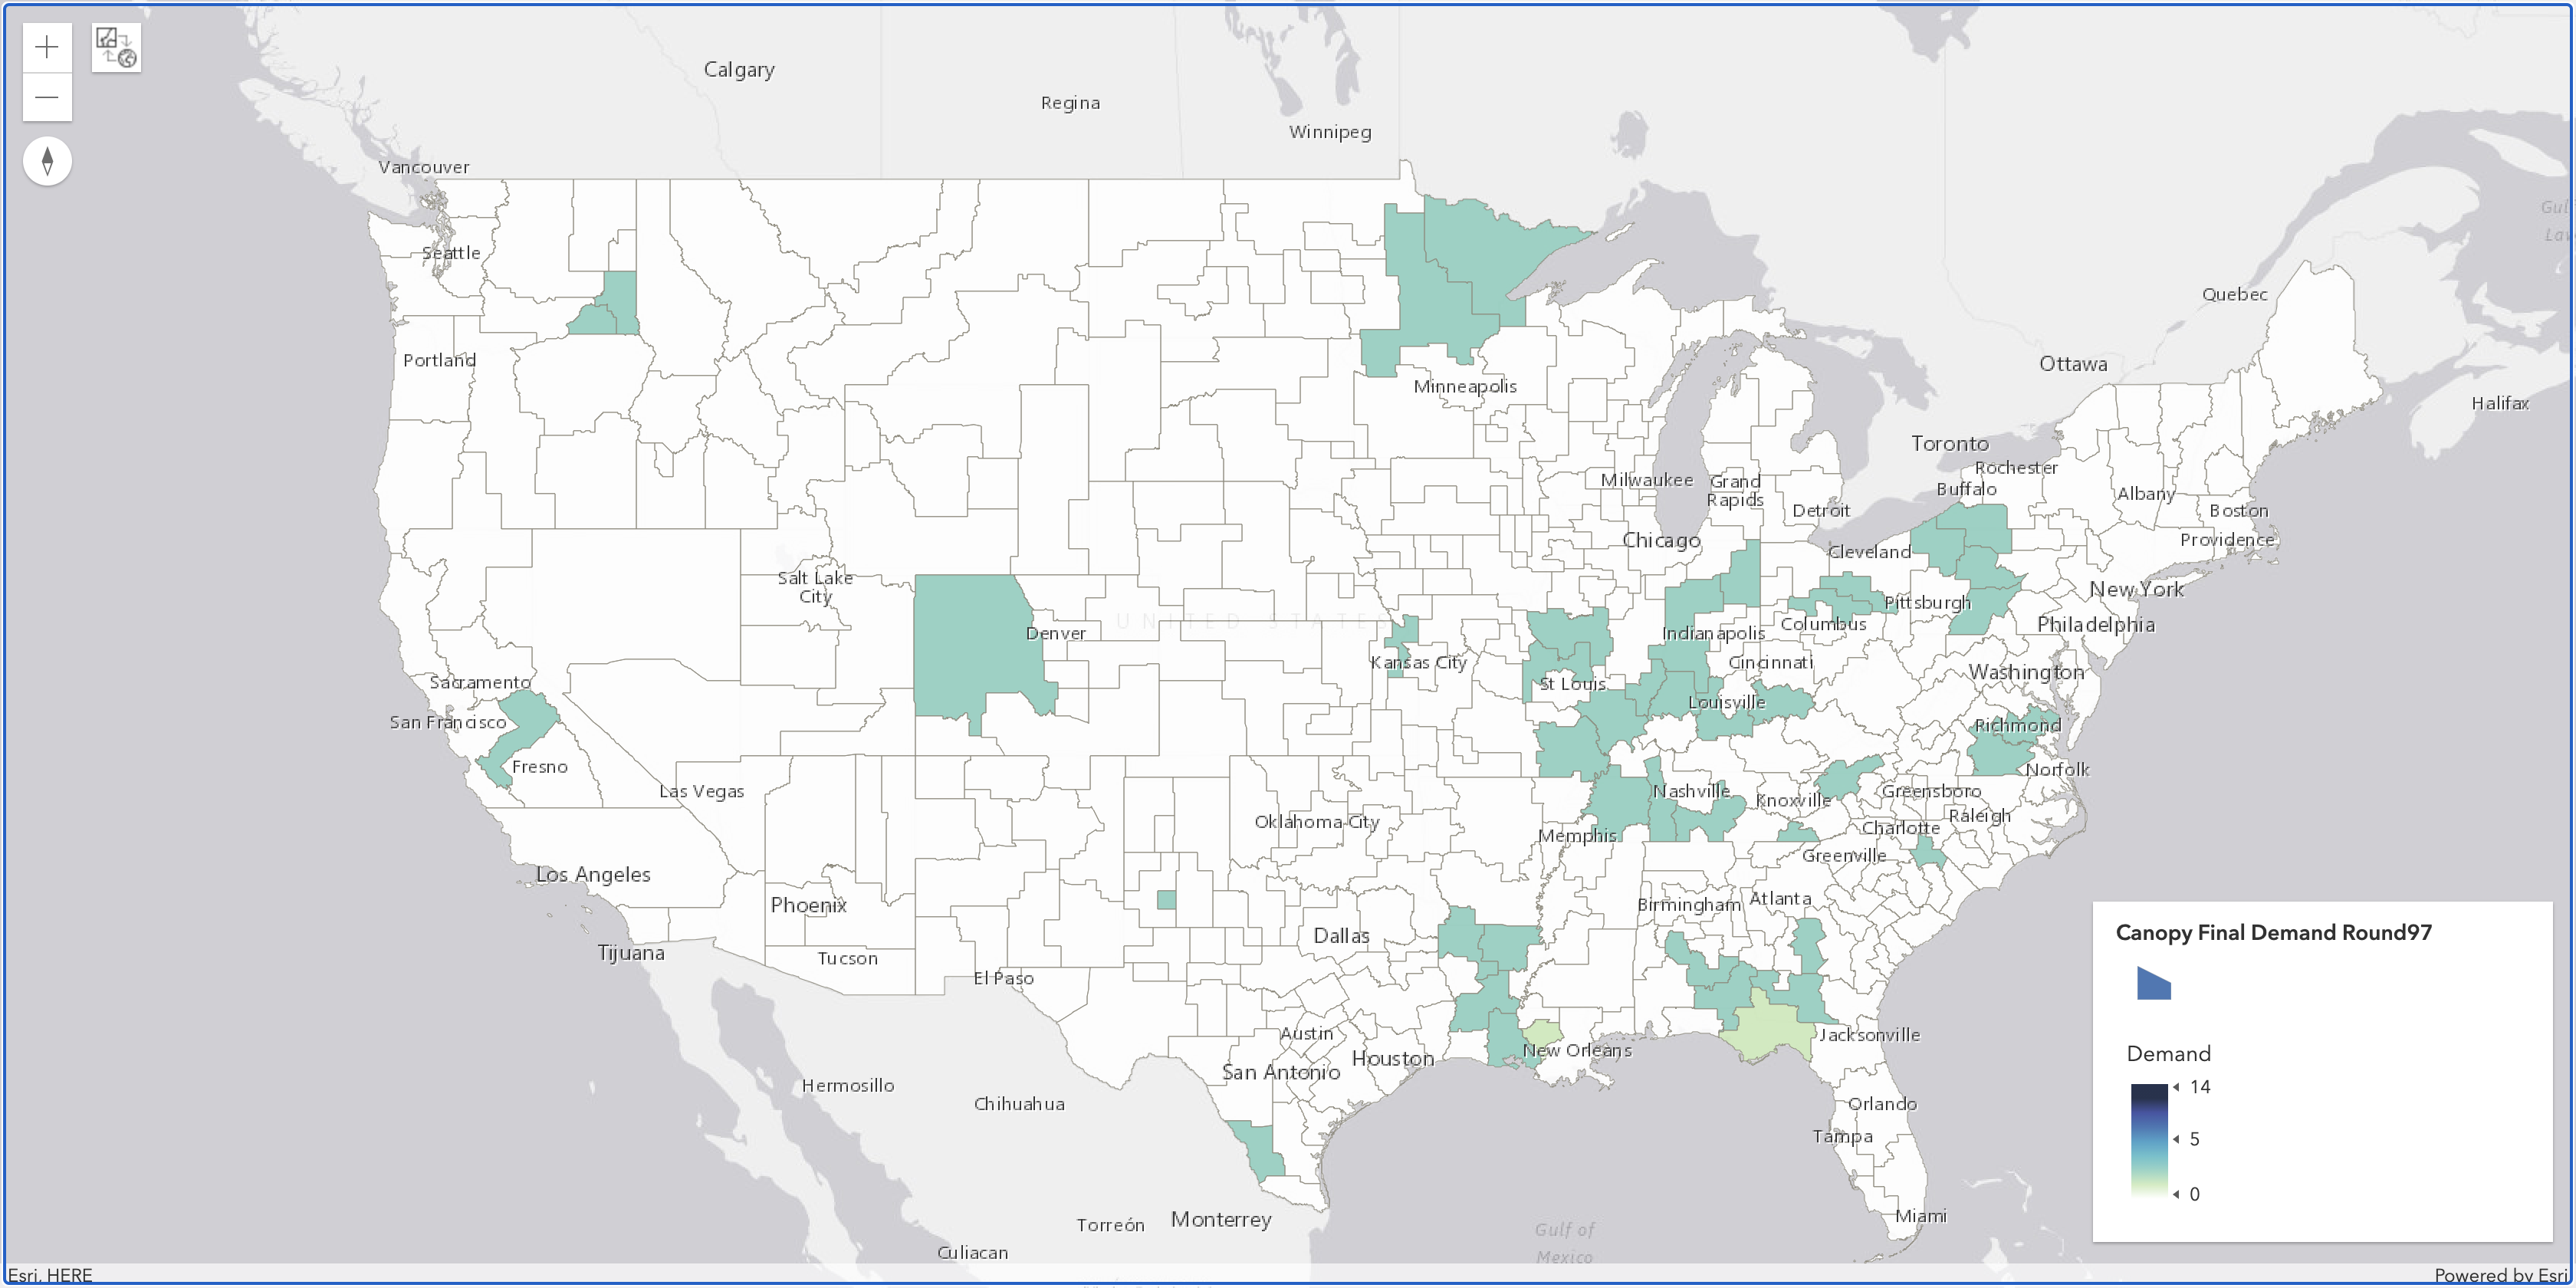
Canopy Spectrum Licenses Won (All Categories)

POST-AUCTION ANALYSIS: Demand Reduction by Bidder In Each Round (in $)
"
POST-AUCTION ANALYSIS: Fun Facts
Question 1: How much did T-Mobile drive up the costs for Verizon in the A block during the clock phase of bidding?
Answer 1(a):
T-Mobile Alone: $0(3)
Answer 1(b):
T-Mobile Together with Other Bidders (approximately): $6,721,040,000(4)
Question 2: Who were the unlucky bidders that won the BC blocks in Tampa and paid more than winners of the A blocks?
Answer 2: AT&T Spectrum Frontiers LLC & Cellco Partnership & T-Mobile License LLC(5)
Question 3: What was the value of blocks where Verizon tried to reduce demand but got stuck?
Answer 3(a):
All Categories (estimate): $3,569,730,558(6)
Answer 3(b):
Just BC Blocks (estimate): $2,955,584,558(7)
Question 4: What was the value of blocks where AT&T tried to reduce demand but got stuck?
Answer 4(a):
All Categories (estimate): $705,189,923(8)
Answer 4(b):
Just BC Blocks (estimate): $47,172,160(9)
Question 5: What was the value of blocks where T-Mobile tried to reduce demand but got stuck?
Answer 5(a):
All Categories (estimate): $117,864,640(10)
Answer 5(b):
Just BC Blocks (estimate): $117,864,640(11)
Question 1: How much did T-Mobile drive up the costs for Verizon in the A block during the clock phase of bidding?
Answer 1(a):
T-Mobile Alone: $0(3)
(3) This number is the sum of the increases in price that Verizon paid for A block licenses during the clock rounds for PEAs where the price would not have gone up but for T-Mobile's participation.
Answer 1(b):
T-Mobile Together with Other Bidders (approximately): $6,721,040,000(4)
(4) This number is the sum of the increases in price that Verizon paid for A block licenses during the clock rounds for PEAs where T-Mobile's participation contributed, but was not solely responsible for, increasing the price.
Question 2: Who were the unlucky bidders that won the BC blocks in Tampa and paid more than winners of the A blocks?
Answer 2: AT&T Spectrum Frontiers LLC & Cellco Partnership & T-Mobile License LLC(5)
(5) These bidders were unluckly because in Tampa, the BC blocks finished with higher fully-loaded prices than the A blocks during the clock stage of the auction.
Question 3: What was the value of blocks where Verizon tried to reduce demand but got stuck?
Answer 3(a):
All Categories (estimate): $3,569,730,558(6)
(6) This number is the product of (a) the number of blocks across any category where Verizon tried to reduce demand but was not able to because demand fell below supply in that round and subsequent rounds and (b) the final posted price.
Answer 3(b):
Just BC Blocks (estimate): $2,955,584,558(7)
(7) This number is the product of (a) the number of BC blocks only where Verizon tried to reduce demand but was not able to because demand fell below supply in that round and subsequent rounds and (b) the final posted price.
Question 4: What was the value of blocks where AT&T tried to reduce demand but got stuck?
Answer 4(a):
All Categories (estimate): $705,189,923(8)
(8) This number is the product of (a) the number of blocks across any category where AT&T tried to reduce demand but was not able to because demand fell below supply in that round and subsequent rounds and (b) the final posted price.
Answer 4(b):
Just BC Blocks (estimate): $47,172,160(9)
(9) This number is the product of (a) the number of BC blocks only where AT&T tried to reduce demand but was not able to because demand fell below supply in that round and subsequent rounds and (b) the final posted price.
Question 5: What was the value of blocks where T-Mobile tried to reduce demand but got stuck?
Answer 5(a):
All Categories (estimate): $117,864,640(10)
(10) This number is the product of (a) the number of blocks across any category where T-Mobile tried to reduce demand but was not able to because demand fell below supply in that round and subsequent rounds and (b) the final posted price.
Answer 5(b):
Just BC Blocks (estimate): $117,864,640(11)
(11) This number is the product of (a) the number of BC blocks only where T-Mobile tried to reduce demand but was not able to because demand fell below supply in that round and subsequent rounds and (b) the final posted price.
POST-AUCTION ANALYSIS: Maps Showing Where Key Bidders Got Stuck with More Licenses Than They Wanted
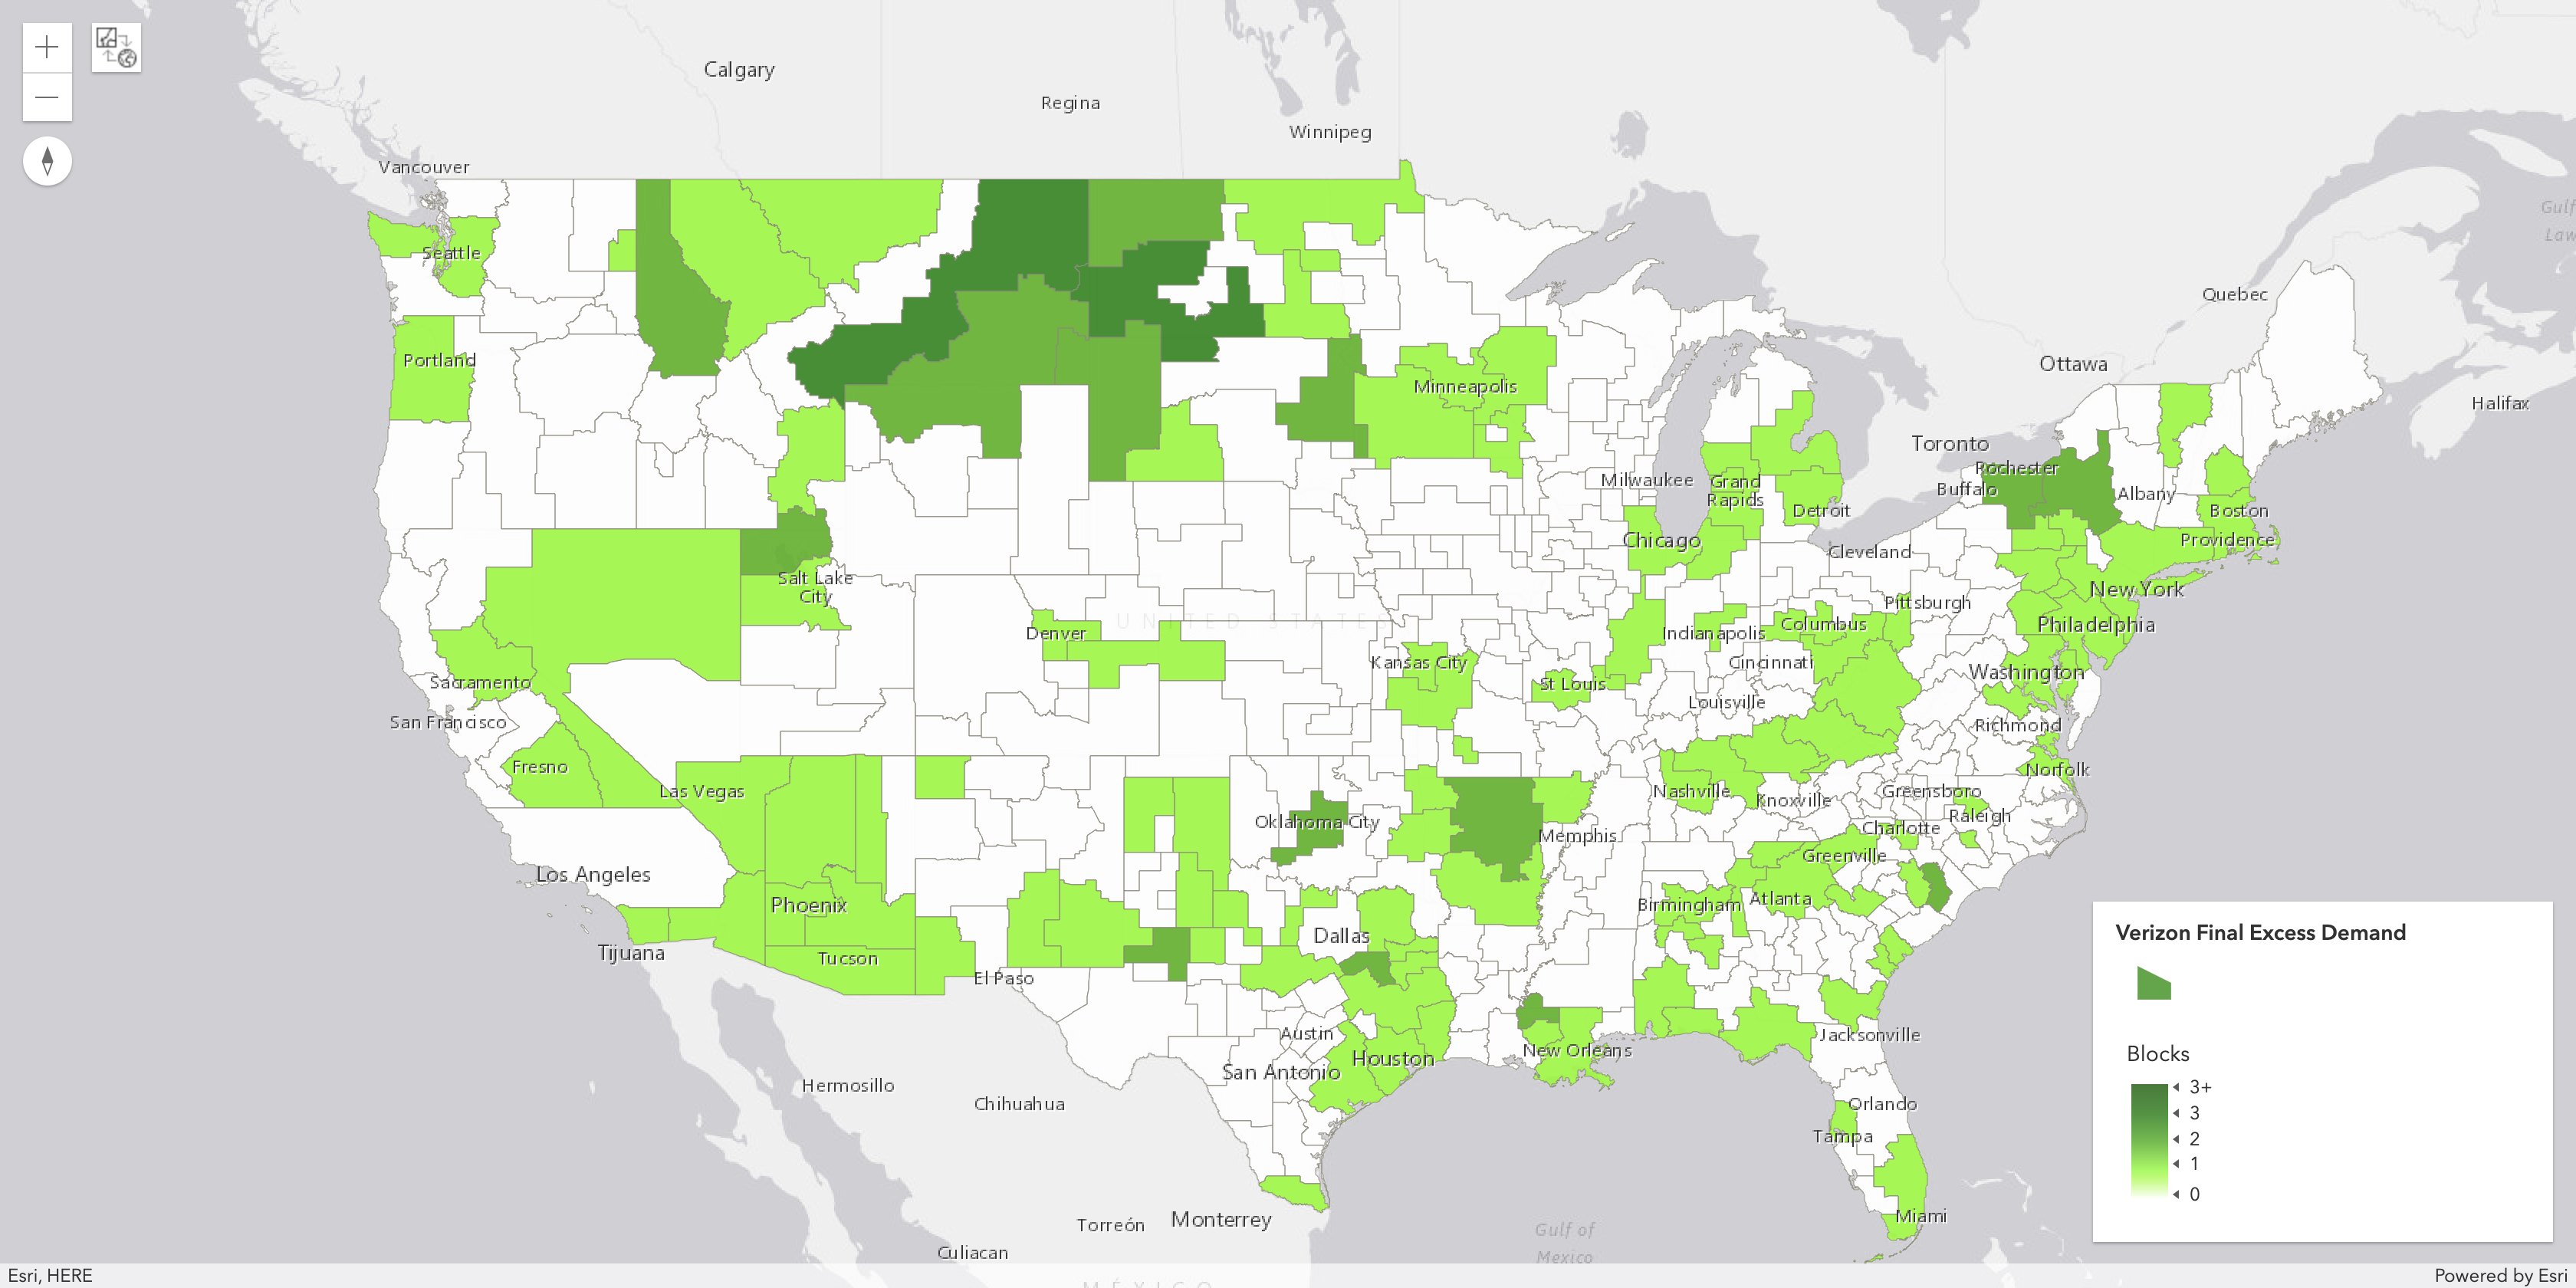
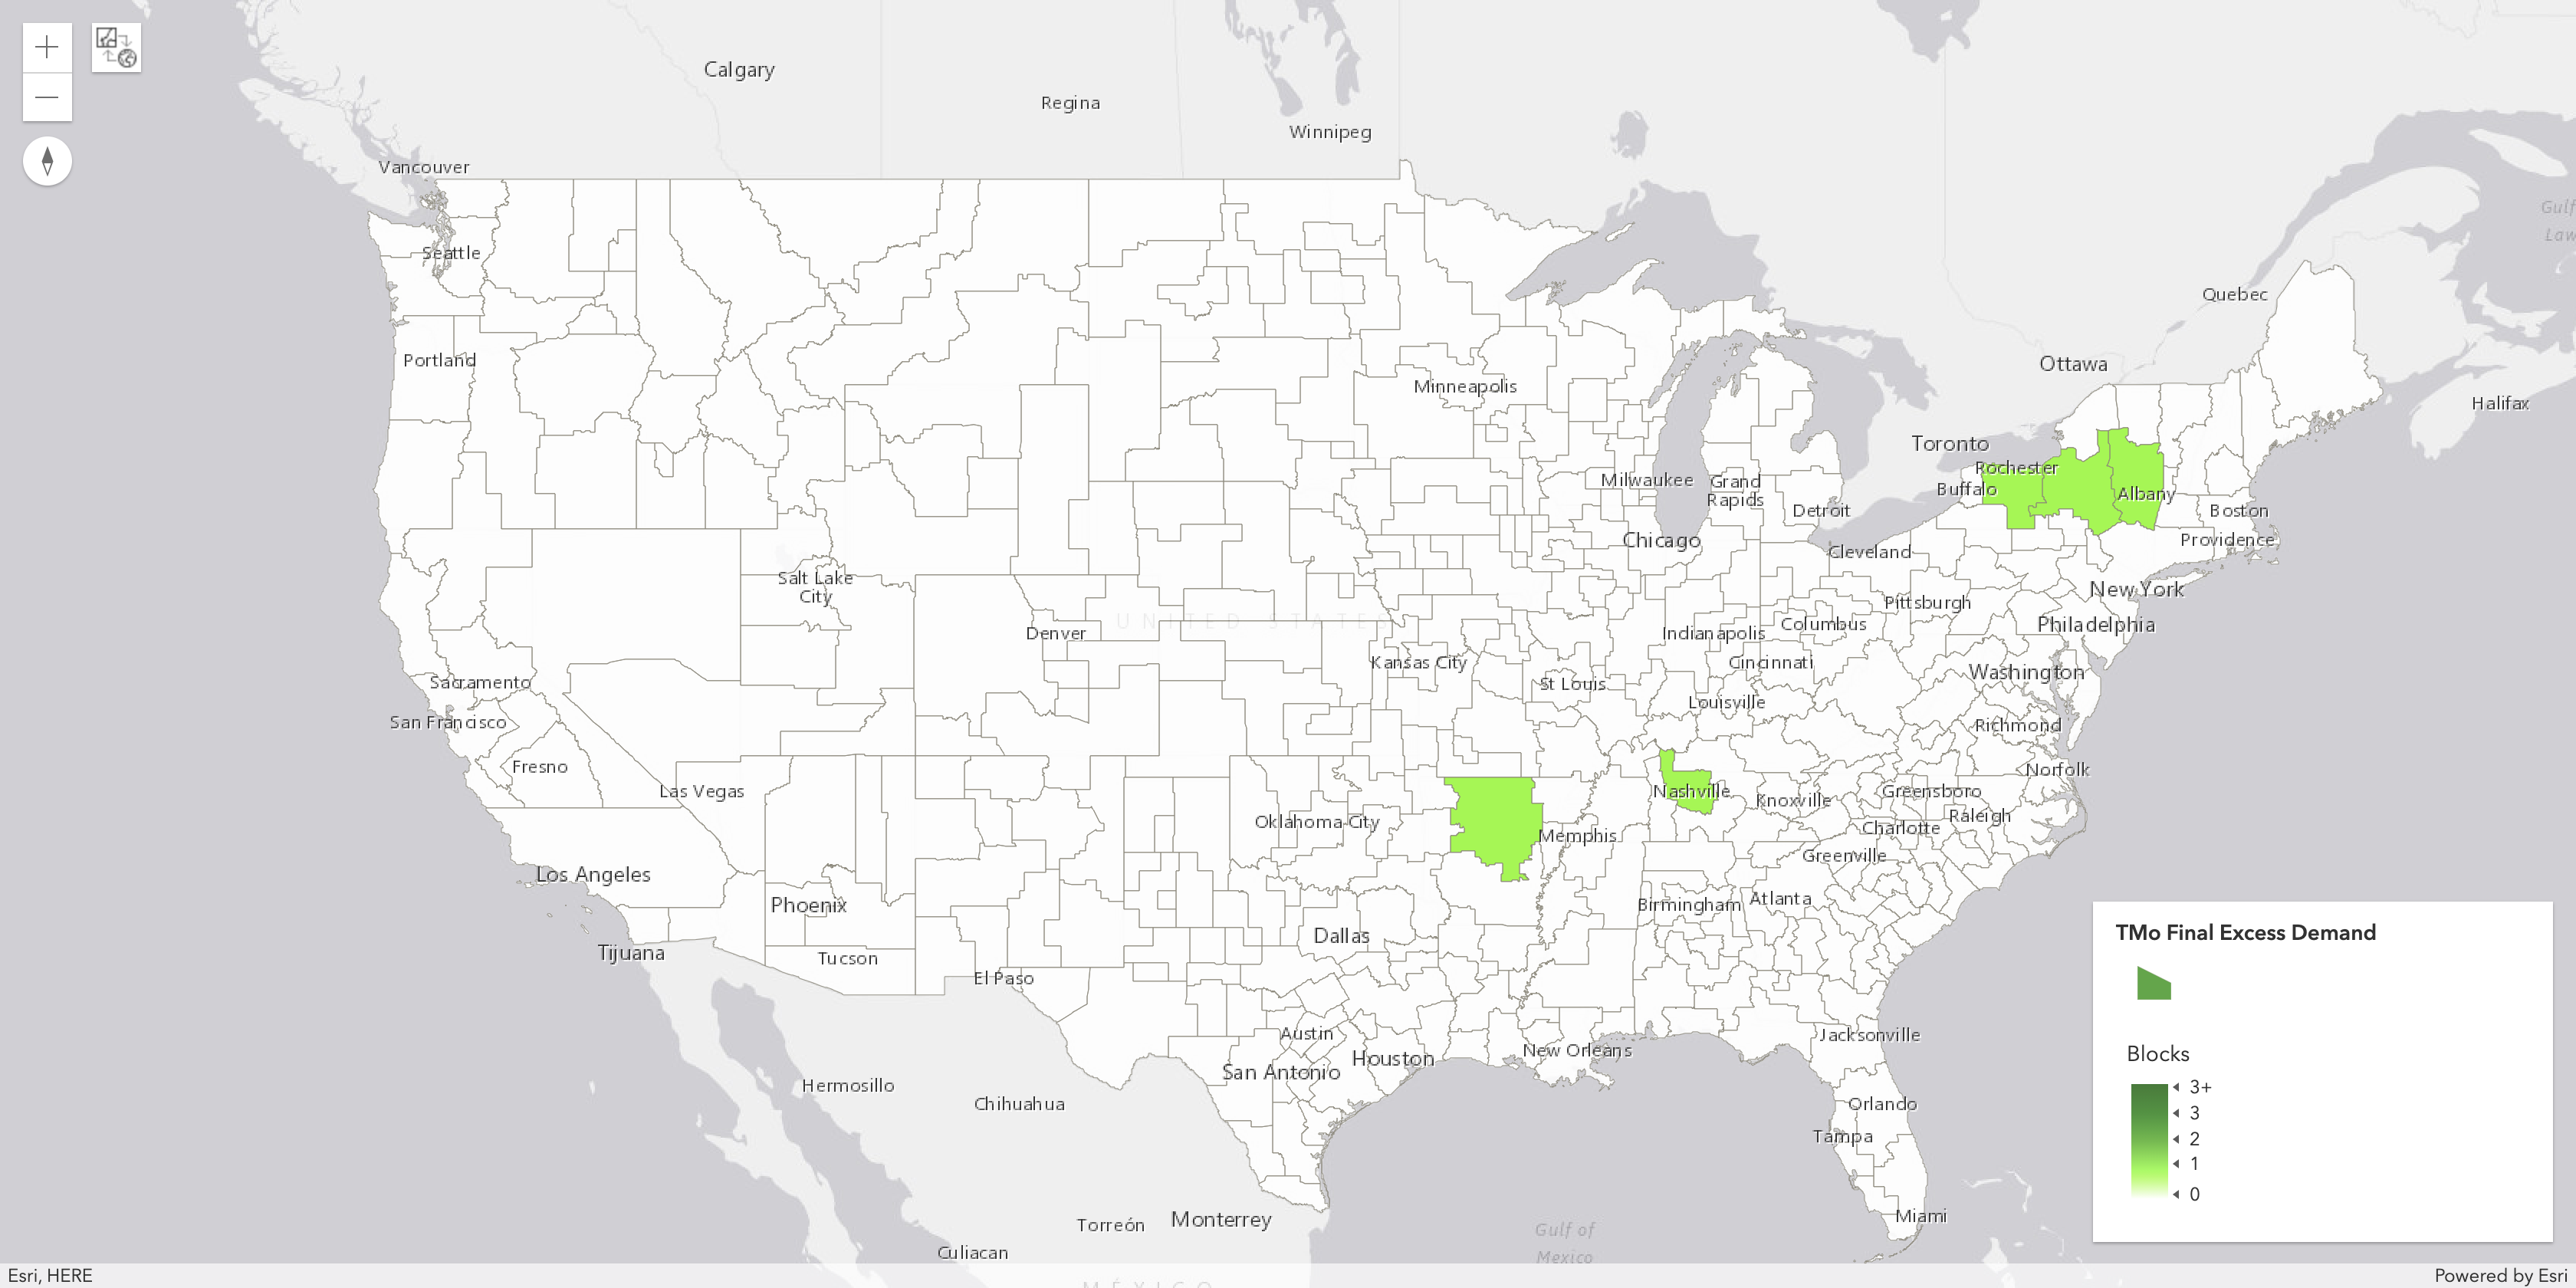
Verizon Excess Blocks (All Categories)

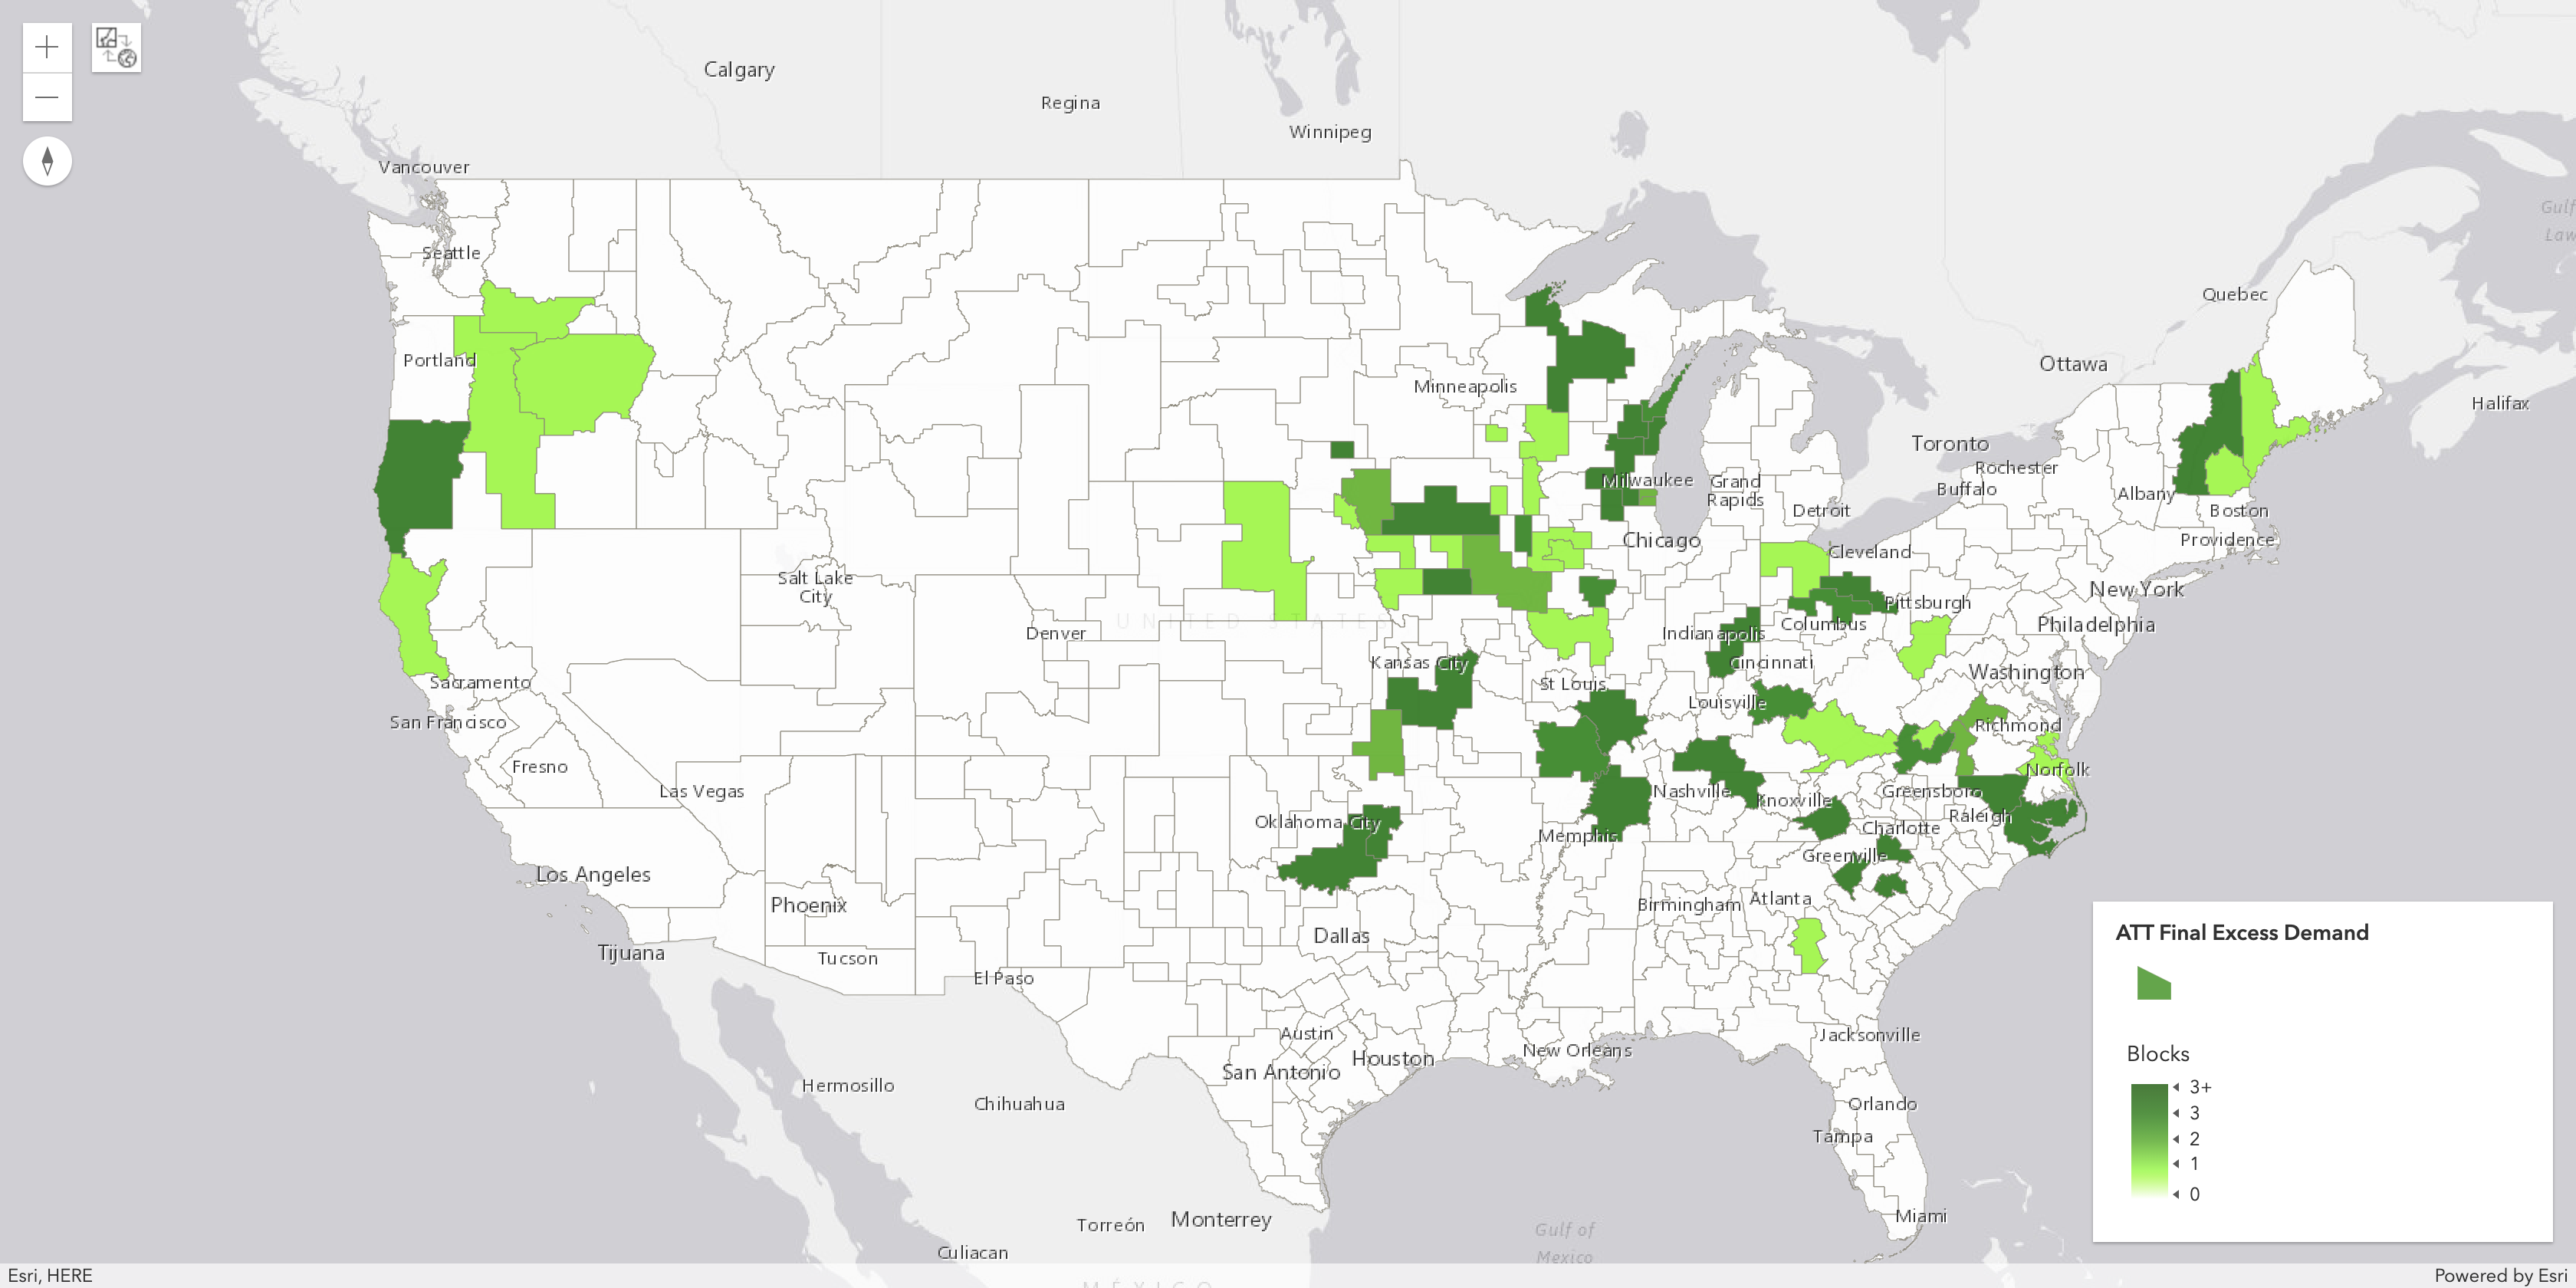
AT&T Excess Blocks (All Categories)

T-Mobile Excess Blocks (All Categories)

POST-AUCTION ANALYSIS: Network Graph for Selected Round
Network Graphs show interconnections between a set of entities. In the network graph below, I show the interconnections between PEAs and bidders in each round. These interconnections are repsented by "nodes" and "edges."
Each node in the graph represents a pairing between PEA and bidder. Thus, a PEA may appear more than once in the graph as a node if more than one bidder increased/decreased demand in the PEA in the round. Each node is color coded based on whether the bidder increased or reduced demand in the PEA in the round and each node is also sized according to population. You can hover over each node to get information about this PEA including the number of connections to that node and the demand change in the PEA in the round.
An edge (or line between nodes) in the graph means that a bidder changed its demand in one or more PEAs and moved into one or more new PEAs in the same round. While you cannot say definitively that a bidder moved its demand from one PEA to another specific PEA if there are more than one PEA with shifting demand in the same round, an edge does indicate that the bidder decided to reduce demand in a PEA (node) at one end of the edge and increased its demand in a PEA (node) at the other end of the edge in the same round. Because there can be a lot of edges in a round, you may have to zoom in the graph to better follow these edges. I have also inserted small light blue markers (in the shape of a cross) in the middle of each edge which reveals which nodes are connected by the edge highlighted.
Please use the dropdown to generate the network graph for a specific round. As not every round had a specific bidder reduce demand in one PEA and increase its demand in another PEA, not all rounds are available to be selected.
Select Round Number
Please Select a Round to Display Network Graph
CLOCK STAGE ANALYSIS: Auction 107 Summary (3700-3980 MHz Band)
General Auction Statistics at End of Round
97:
PEA-Level Statistics at the End of Round 97:
| Gross Proceeds after Round 97: | $80,916,832,754 |
| Qualified Bidders (Clock Phase): | 57 |
| Products with Supply < Demand after Round 97: | 0 |
| Products with Supply = Demand after Round 97: | 452 |
| Products with Supply > Demand after Round 97: | 0 |
|
Products with No Demand after Round
97: (subset of Products with Supply > Demand) |
0 |
| Total Provisionally Sold Blocks after Round 97: | 5684 |
| Total Unsold Blocks after Round 97: | 0 |
PEA-Level Statistics at the End of Round 97:
| PEAs with Supply < Demand after Round 97: | 0 |
| PEAs with Supply = Demand after Round 97: | 406 |
| PEAs with Supply > Demand after Round 97: | 0 |
|
PEAs with No Demand after Round
97: (subset of PEAs with Supply > Demand) |
0 |
| Largest PEA (by Population) with Demand Change after Round 97: | Franklin, NC |
Nationwide Price Per MHz-POP Statistics at End of Round
97:
Nationwide Gross Proceeds by Category at End of Round 97:
Minimum Proceeds Required to Purchase One Block Nationwide at End of Round 97:
| Based on Auction Prices Only | Fully-Loaded Prices (1) | |
| Average Across All Categories: | $0.942329 | $1.093722 |
| Category A: | $1.308321 | $1.614709 |
| Category BC: | $1.182931 | $1.338067 |
| Category ABC: | $0.552014 | $0.624408 |
| Category BC and ABC: | $0.847198 | $0.958305 |
(1) Fully-Loaded Prices include an estimated $9.7 B in accelerated clearing payments and $3.3 B in relocation costs.
Nationwide Gross Proceeds by Category at End of Round 97:
| Category A: | $23,176,850,950 |
| Category BC: | $37,720,039,806 |
| Category ABC: | $20,019,941,998 |
Minimum Proceeds Required to Purchase One Block Nationwide at End of Round 97:
| Any Category: | $5,606,532,882 |
| Just Category A (where available): | $4,635,370,190 |
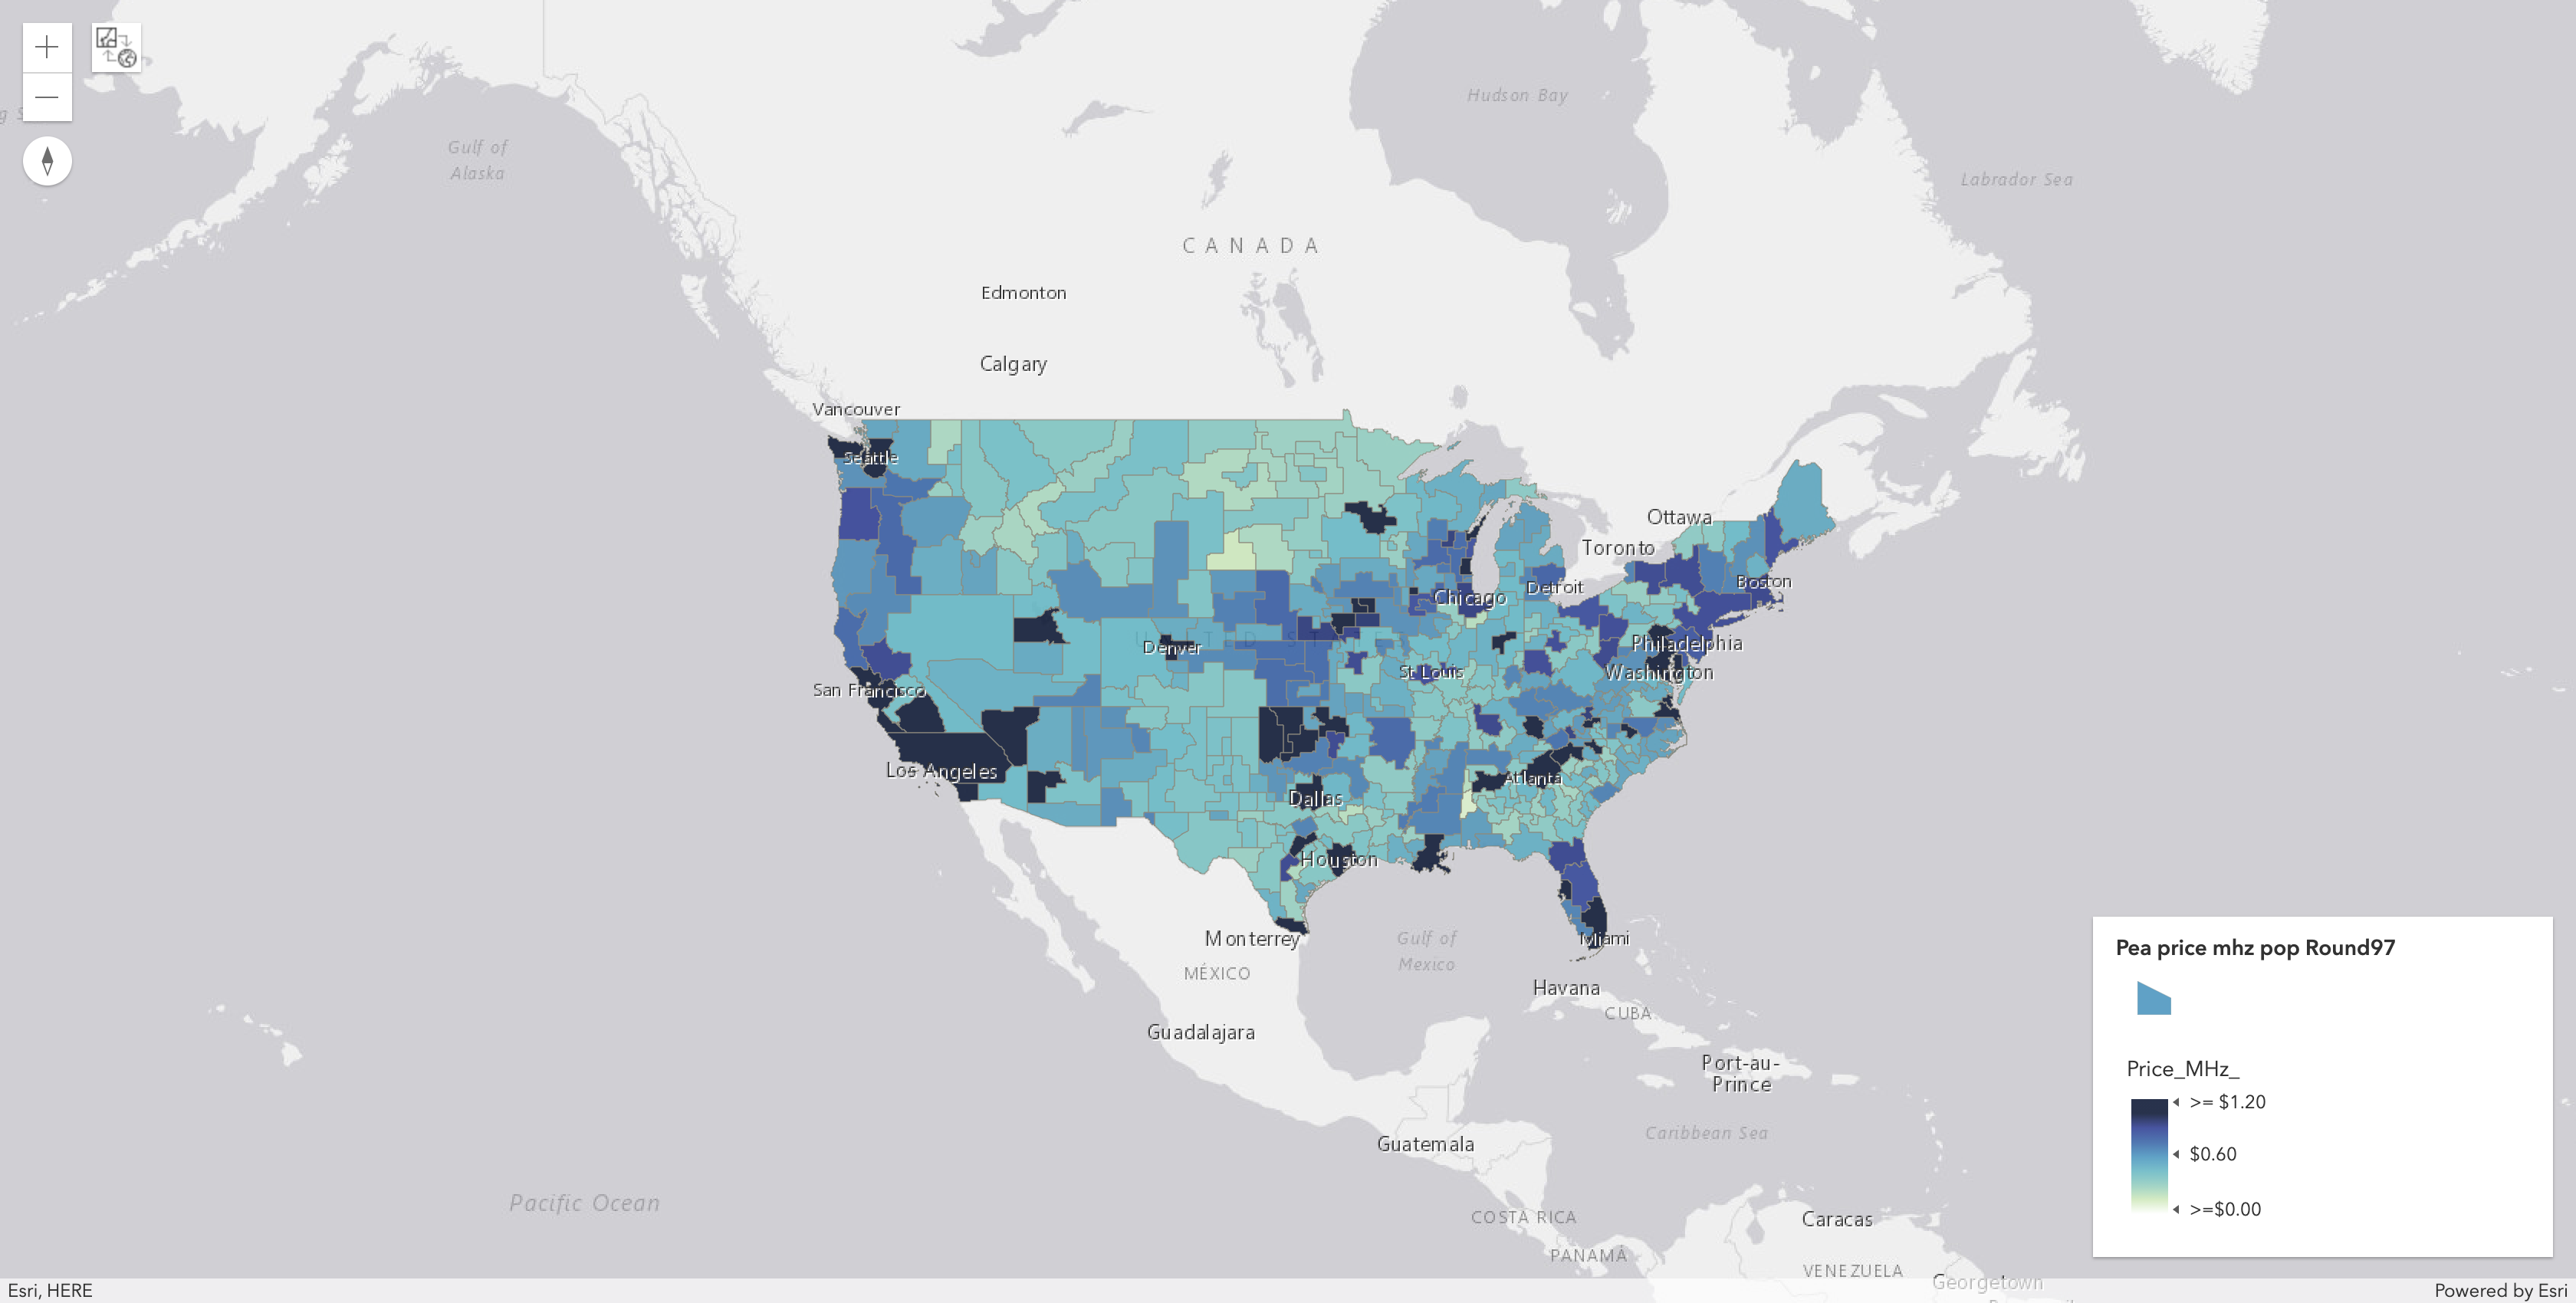
Average Price Per MHz POP in Each PEA after Round
97: (average across all categories in each PEA)

FULLY LOADED(1) Average Price Per MHz POP in Each PEA after Round
97: (average across all categories in each PEA)
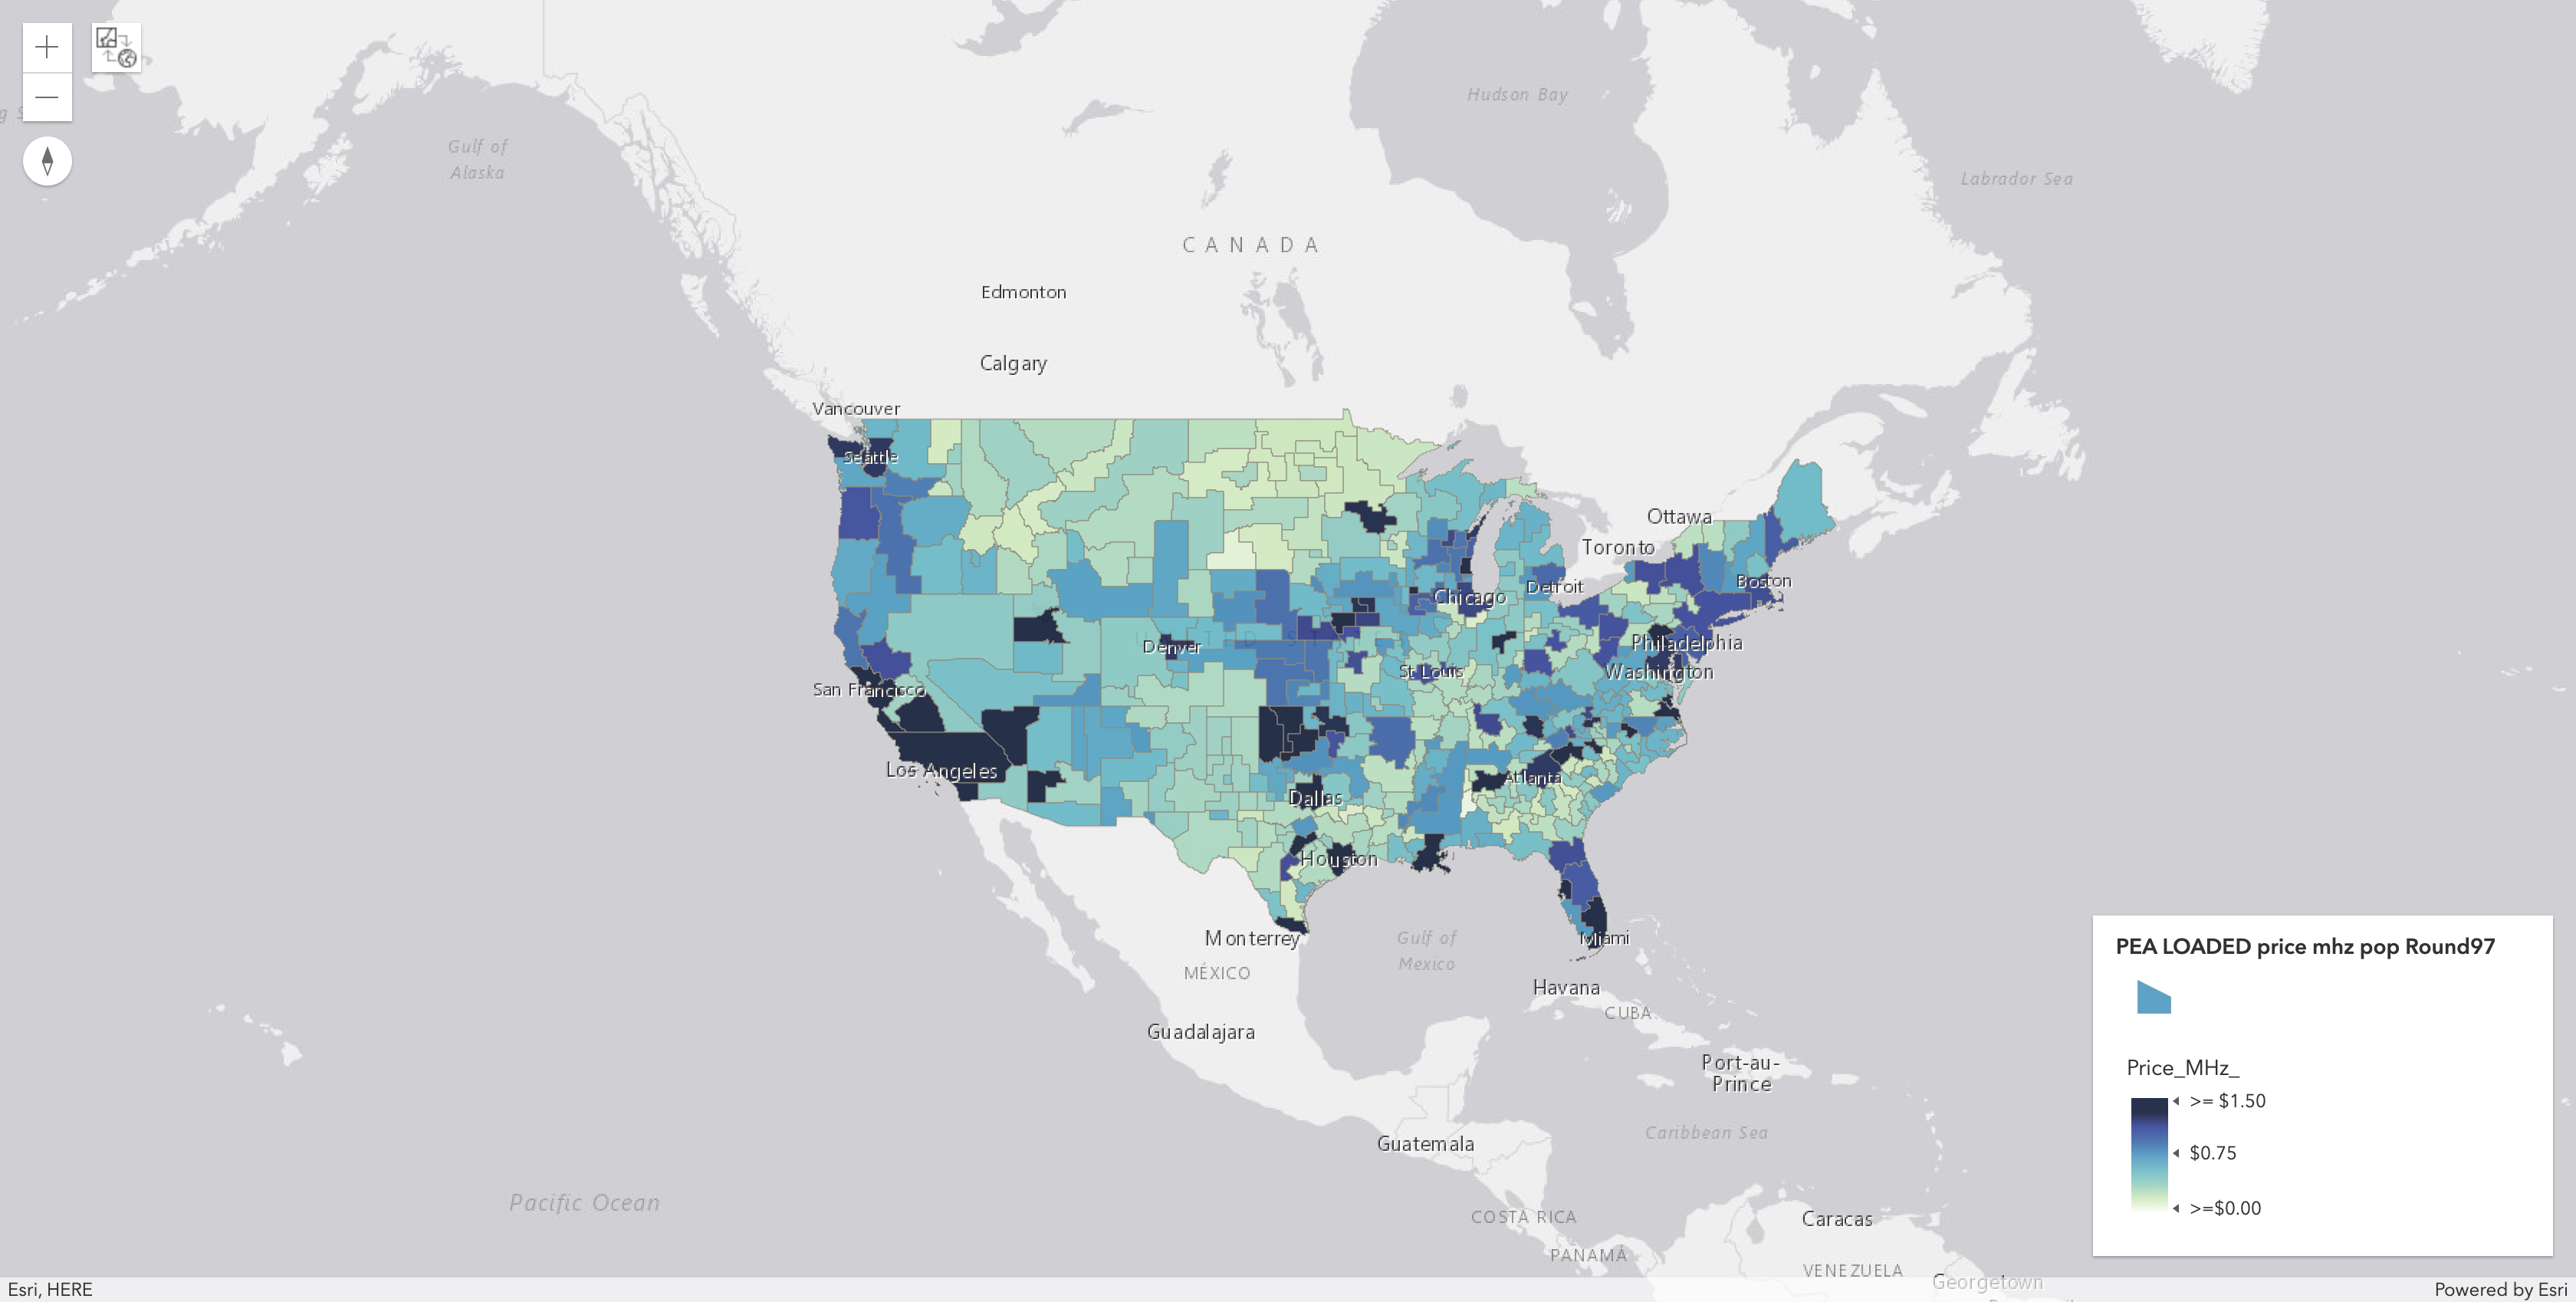
(1) Fully-Loaded Prices (at PEA-level) shown in map include an estimated $9.7 B in accelerated clearing payments and $3.3 B in relocation costs. Fully-Loaded Prices for each product are available in the Excel download below.

Price Per MHz-POP in Top 20 PEAs by Population after Round
97:
| market_number | market_name | category | aggregate_demand | posted_price | supply | gross_proceeds | price_mhz_pop |
|---|---|---|---|---|---|---|---|
| PEA001 | New York, NY | A | 5 | $515,053,000 | 5 | $2,575,265,000 | $1.020430 |
| PEA001 | New York, NY | BC | 9 | $515,167,123 | 9 | $4,636,504,107 | $1.020656 |
| PEA002 | Los Angeles, CA | A | 5 | $554,174,000 | 5 | $2,770,870,000 | $1.427535 |
| PEA002 | Los Angeles, CA | BC | 9 | $504,023,785 | 9 | $4,536,214,065 | $1.298350 |
| PEA003 | Chicago, IL | A | 5 | $213,170,700 | 5 | $1,065,853,500 | $1.137916 |
| PEA003 | Chicago, IL | BC | 9 | $202,303,000 | 9 | $1,820,727,000 | $1.079904 |
| PEA004 | San Francisco, CA | A | 5 | $246,363,910 | 5 | $1,231,819,550 | $1.364453 |
| PEA004 | San Francisco, CA | BC | 9 | $223,606,320 | 9 | $2,012,456,880 | $1.238413 |
| PEA005 | Baltimore, MD-Washington, DC | ABC | 14 | $193,803,000 | 14 | $2,713,242,000 | $1.235652 |
| PEA006 | Philadelphia, PA | A | 5 | $140,715,960 | 5 | $703,579,800 | $0.927318 |
| PEA006 | Philadelphia, PA | BC | 9 | $140,944,123 | 9 | $1,268,497,107 | $0.928822 |
| PEA007 | Boston, MA | A | 5 | $151,870,360 | 5 | $759,351,800 | $1.120643 |
| PEA007 | Boston, MA | BC | 9 | $138,451,123 | 9 | $1,246,060,107 | $1.021623 |
| PEA008 | Dallas, TX | A | 5 | $223,058,000 | 5 | $1,115,290,000 | $1.728469 |
| PEA008 | Dallas, TX | BC | 9 | $201,100,910 | 9 | $1,809,908,190 | $1.558325 |
| PEA009 | Miami, FL | A | 5 | $206,971,000 | 5 | $1,034,855,000 | $1.644747 |
| PEA009 | Miami, FL | BC | 9 | $188,155,000 | 9 | $1,693,395,000 | $1.495221 |
| PEA010 | Houston, TX | A | 5 | $168,355,690 | 5 | $841,778,450 | $1.428681 |
| PEA010 | Houston, TX | BC | 9 | $153,185,000 | 9 | $1,378,665,000 | $1.299941 |
| PEA011 | Atlanta, GA | ABC | 14 | $134,458,123 | 14 | $1,882,413,722 | $1.236894 |
| PEA012 | Detroit, MI | A | 5 | $100,320,460 | 5 | $501,602,300 | $0.976359 |
| PEA012 | Detroit, MI | BC | 9 | $84,235,560 | 9 | $758,120,040 | $0.819814 |
| PEA013 | Orlando, FL | A | 5 | $89,132,310 | 5 | $445,661,550 | $0.976762 |
| PEA013 | Orlando, FL | BC | 9 | $86,846,183 | 9 | $781,615,647 | $0.951709 |
| PEA014 | Cleveland, OH | A | 5 | $93,503,950 | 5 | $467,519,750 | $1.141217 |
| PEA014 | Cleveland, OH | BC | 9 | $70,443,001 | 9 | $633,987,009 | $0.859758 |
| PEA015 | Phoenix, AZ | A | 5 | $131,886,990 | 5 | $659,434,950 | $1.727573 |
| PEA015 | Phoenix, AZ | BC | 9 | $127,510,450 | 9 | $1,147,594,050 | $1.670246 |
| PEA016 | Seattle, WA | A | 5 | $102,970,300 | 5 | $514,851,500 | $1.357653 |
| PEA016 | Seattle, WA | BC | 9 | $85,268,000 | 9 | $767,412,000 | $1.124250 |
| PEA017 | Minneapolis-St. Paul, MN | A | 5 | $101,395,000 | 5 | $506,975,000 | $1.495461 |
| PEA017 | Minneapolis-St. Paul, MN | BC | 9 | $76,262,000 | 9 | $686,358,000 | $1.124778 |
| PEA018 | San Diego, CA | A | 5 | $123,389,000 | 5 | $616,945,000 | $1.993159 |
| PEA018 | San Diego, CA | BC | 9 | $102,189,980 | 9 | $919,709,820 | $1.650721 |
| PEA019 | Portland, OR | A | 5 | $61,789,770 | 5 | $308,948,850 | $1.022115 |
| PEA019 | Portland, OR | BC | 9 | $59,561,080 | 9 | $536,049,720 | $0.985248 |
| PEA020 | Denver, CO | ABC | 14 | $69,140,123 | 14 | $967,961,722 | $1.239217 |
20 Most Expensive PEAs by Price Per MHz-POP after Round
97: (ave. for all categories)
| market_number | market_name | price_mhz_pop |
|---|---|---|
| PEA369 | Red Oak, IA | $2.834888 |
| PEA038 | Milwaukee, WI | $2.086550 |
| PEA305 | Altus, OK | $2.072642 |
| PEA302 | Enid, OK | $2.056968 |
| PEA047 | Brownsville, TX | $1.793756 |
| PEA406 | Anamosa, IA | $1.789878 |
| PEA018 | San Diego, CA | $1.773020 |
| PEA039 | Oklahoma City, OK | $1.769386 |
| PEA031 | Indianapolis, IN | $1.717353 |
| PEA015 | Phoenix, AZ | $1.690720 |
| PEA008 | Dallas, TX | $1.619091 |
| PEA026 | Las Vegas, NV | $1.585882 |
| PEA050 | Greenville, SC | $1.564964 |
| PEA009 | Miami, FL | $1.548623 |
| PEA027 | Salt Lake City, UT | $1.518333 |
| PEA033 | Virginia Beach, VA | $1.472492 |
| PEA034 | Fresno, CA | $1.470341 |
| PEA021 | Tampa, FL | $1.467440 |
| PEA040 | Birmingham, AL | $1.462691 |
| PEA045 | Raleigh, NC | $1.461076 |
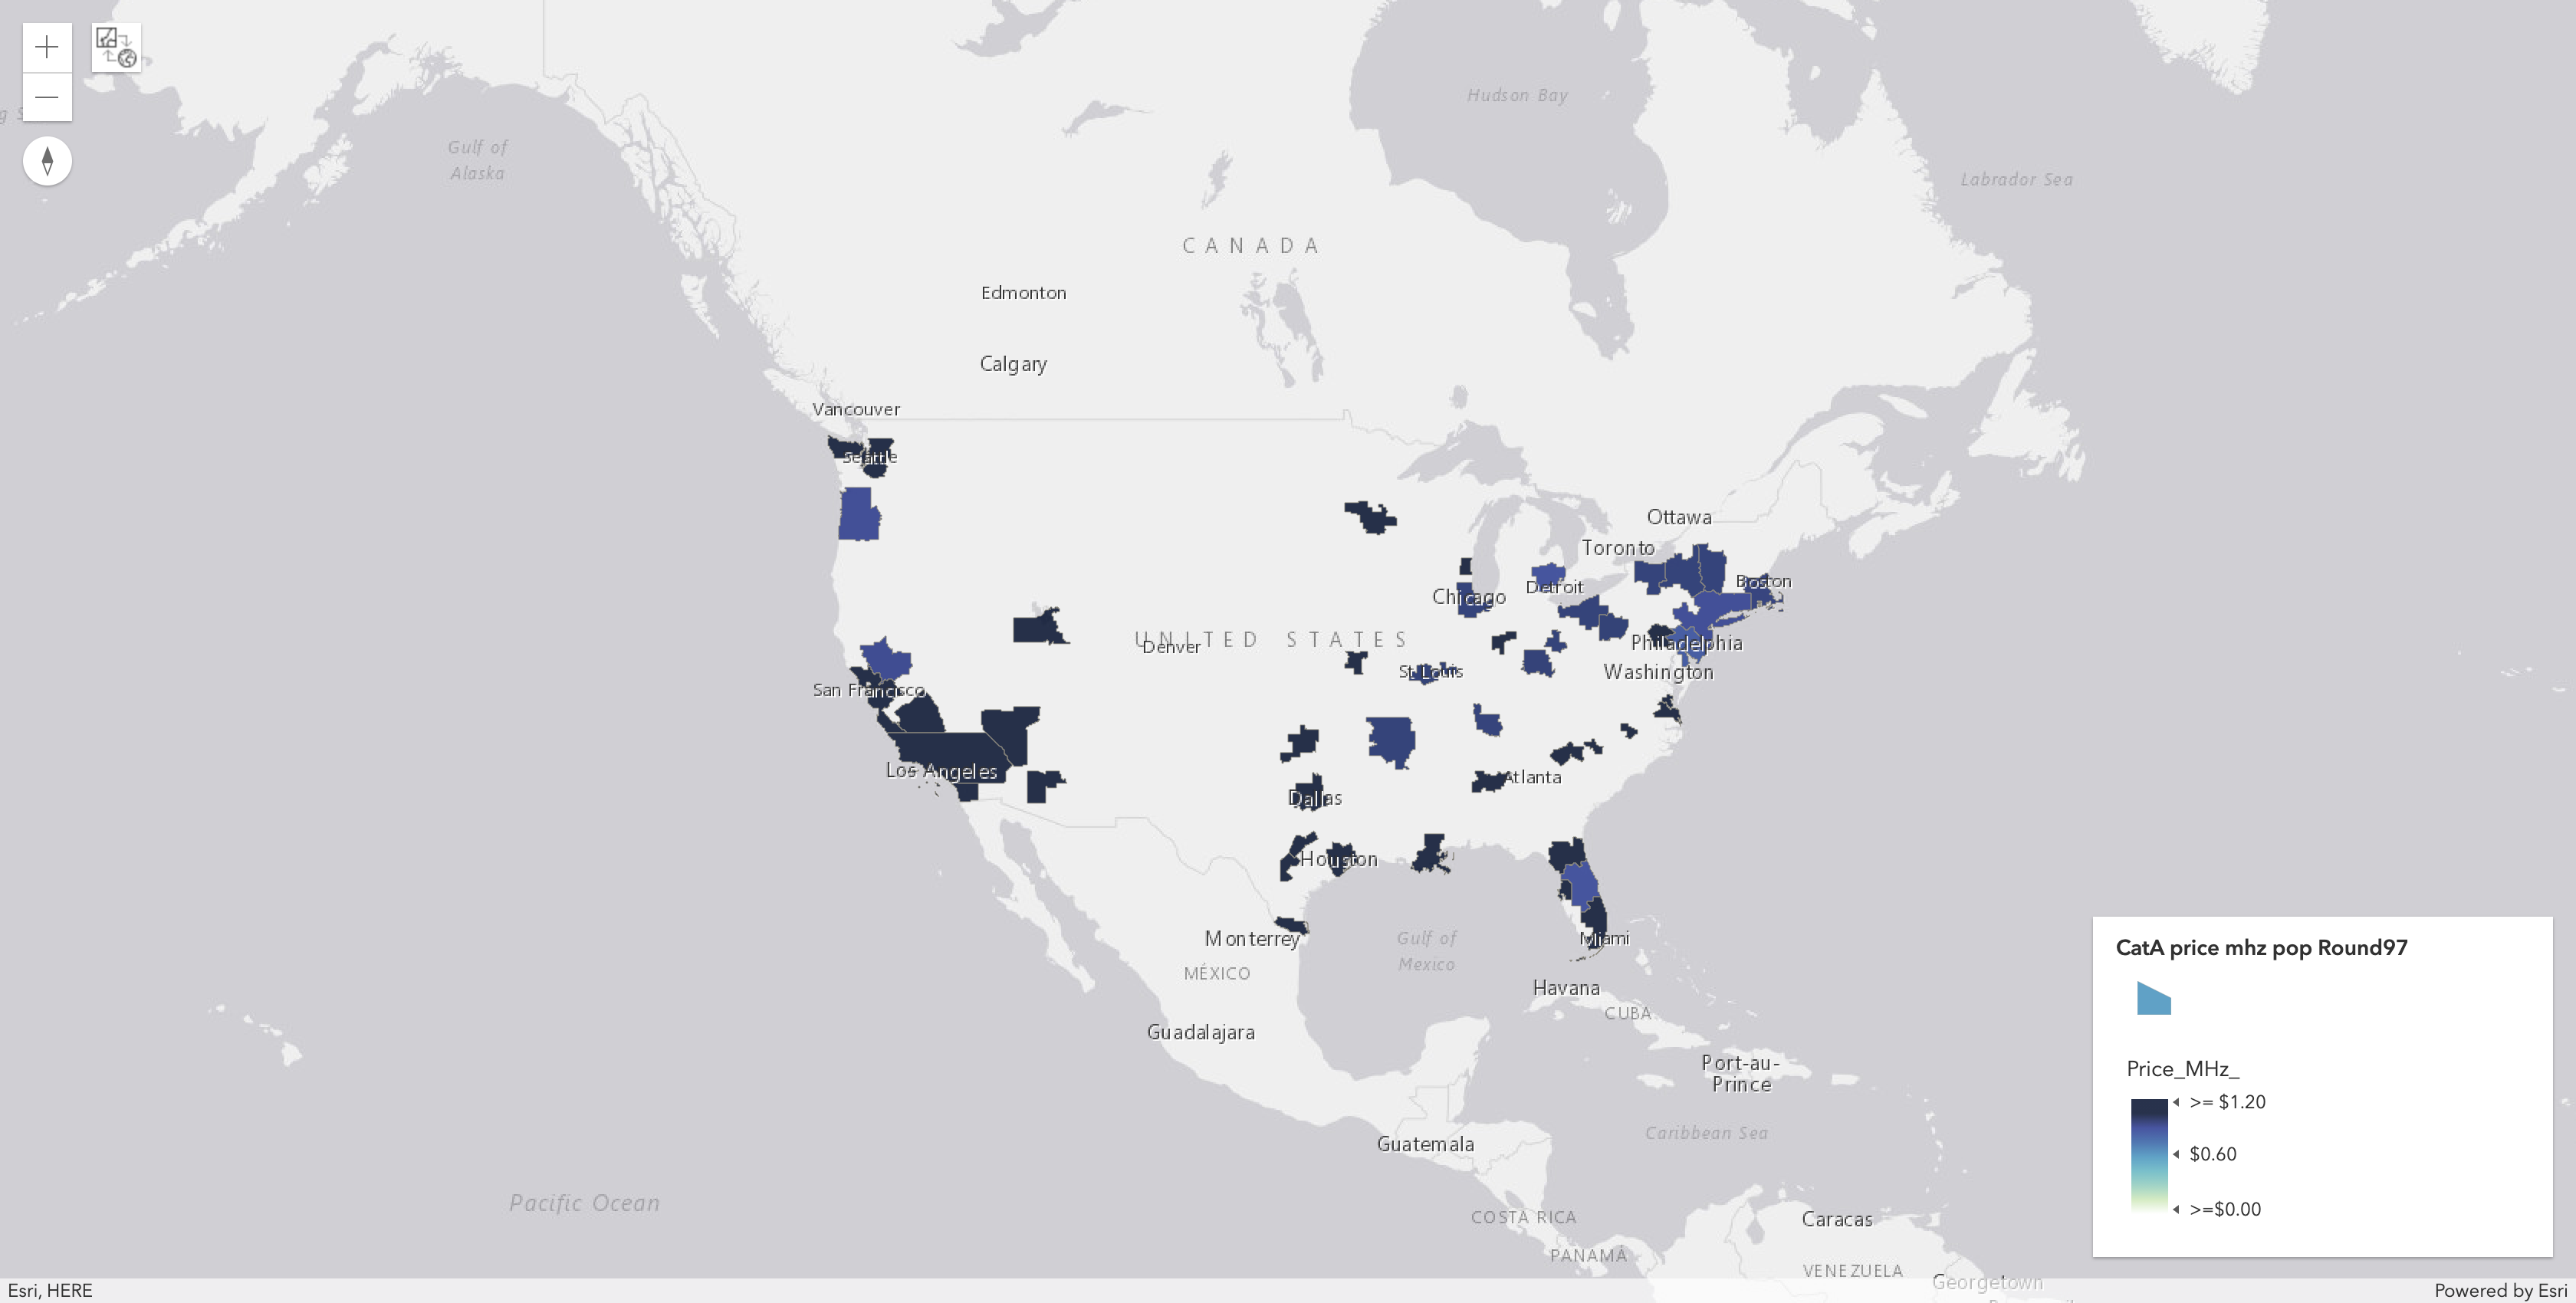
Price Per MHz POP in Each PEA for Category A after Round
97:

Price Per MHz POP in Each PEA for Category BC and ABC after Round
97:
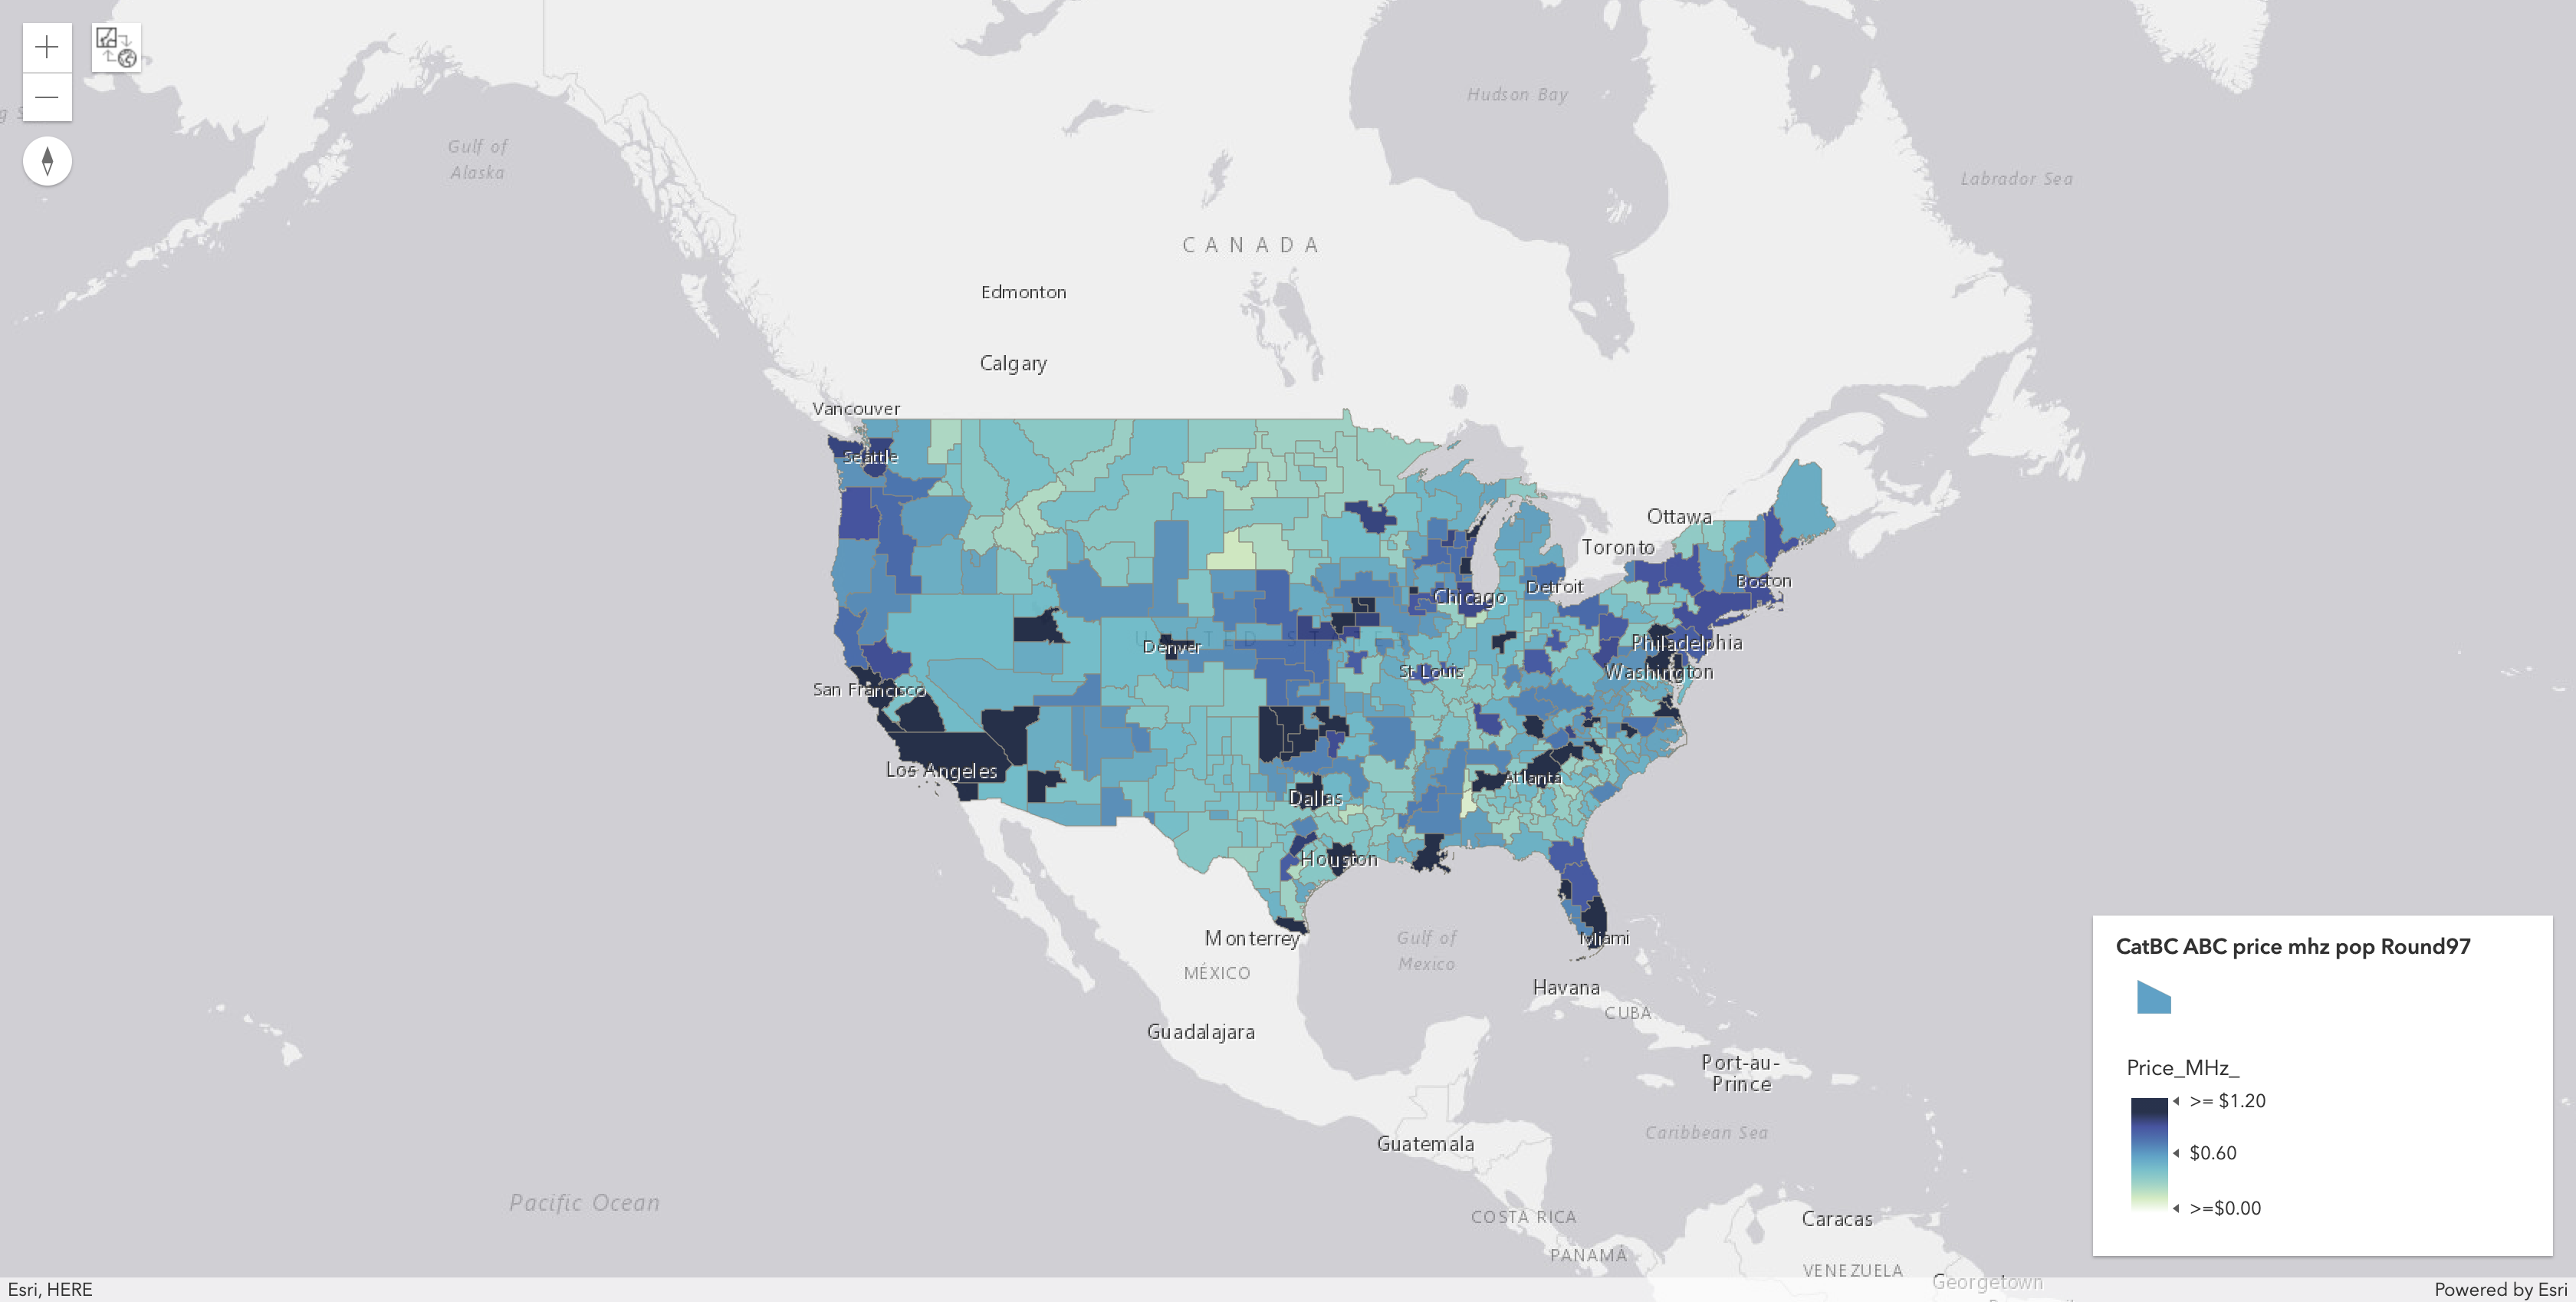

20 Most Expensive Products by Price Per MHz-POP after Round 97: (any category)
| market_number | market_name | category | aggregate_demand | posted_price | supply | gross_proceeds | price_mhz_pop |
|---|---|---|---|---|---|---|---|
| PEA369 | Red Oak, IA | ABC | 14 | $3,696,864 | 14 | $51,756,096 | $2.834888 |
| PEA038 | Milwaukee, WI | A | 5 | $69,814,000 | 5 | $349,070,000 | $2.243513 |
| PEA305 | Altus, OK | ABC | 14 | $5,913,000 | 14 | $82,782,000 | $2.072642 |
| PEA302 | Enid, OK | ABC | 14 | $5,913,000 | 14 | $82,782,000 | $2.056968 |
| PEA038 | Milwaukee, WI | BC | 9 | $62,216,050 | 9 | $559,944,450 | $1.999349 |
| PEA018 | San Diego, CA | A | 5 | $123,389,000 | 5 | $616,945,000 | $1.993159 |
| PEA031 | Indianapolis, IN | A | 5 | $64,869,000 | 5 | $324,345,000 | $1.833482 |
| PEA039 | Oklahoma City, OK | BC | 9 | $52,572,123 | 9 | $473,149,107 | $1.817184 |
| PEA047 | Brownsville, TX | BC | 9 | $45,918,000 | 9 | $413,262,000 | $1.816246 |
| PEA406 | Anamosa, IA | ABC | 14 | $738,790 | 14 | $10,343,060 | $1.789878 |
| PEA047 | Brownsville, TX | A | 5 | $44,326,000 | 5 | $221,630,000 | $1.753276 |
| PEA008 | Dallas, TX | A | 5 | $223,058,000 | 5 | $1,115,290,000 | $1.728469 |
| PEA015 | Phoenix, AZ | A | 5 | $131,886,990 | 5 | $659,434,950 | $1.727573 |
| PEA039 | Oklahoma City, OK | A | 5 | $48,700,200 | 5 | $243,501,000 | $1.683349 |
| PEA035 | Austin, TX | A | 5 | $54,659,750 | 5 | $273,298,750 | $1.677905 |
| PEA026 | Las Vegas, NV | A | 5 | $72,105,600 | 5 | $360,528,000 | $1.675740 |
| PEA015 | Phoenix, AZ | BC | 9 | $127,510,450 | 9 | $1,147,594,050 | $1.670246 |
| PEA050 | Greenville, SC | A | 5 | $40,747,920 | 5 | $203,739,600 | $1.668673 |
| PEA031 | Indianapolis, IN | BC | 9 | $58,477,740 | 9 | $526,299,660 | $1.652837 |
| PEA018 | San Diego, CA | BC | 9 | $102,189,980 | 9 | $919,709,820 | $1.650721 |
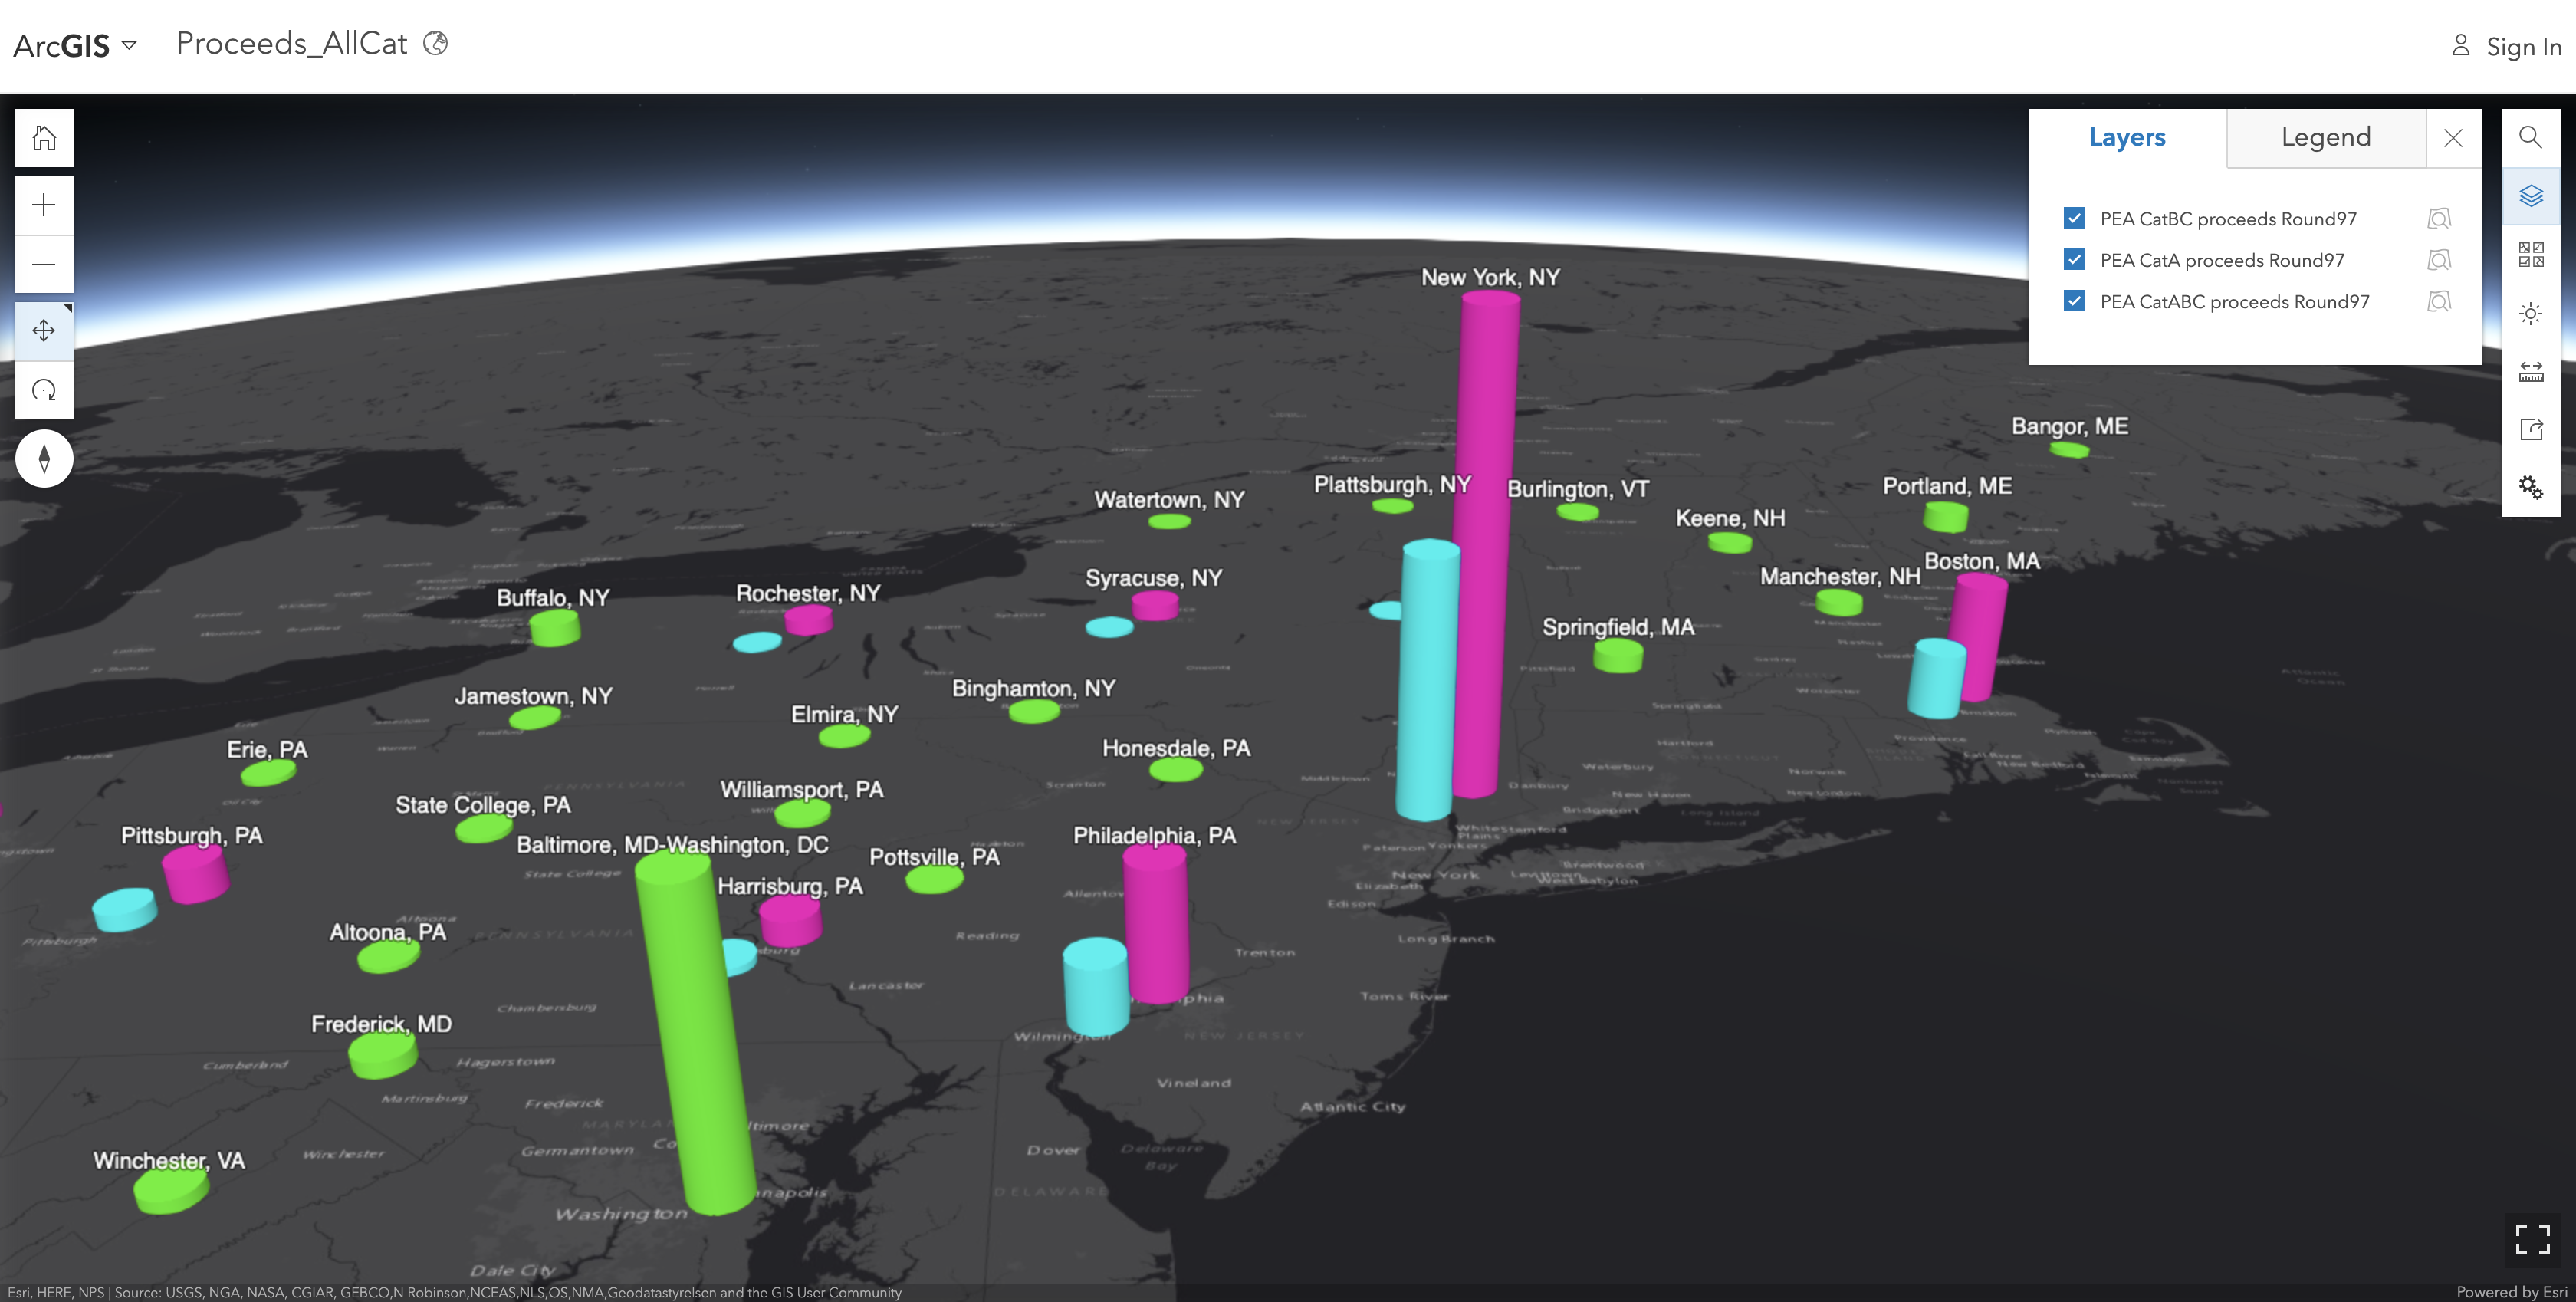
3D Map of Gross Proceeds by Category in Each PEA after Round
97

Treemap of Gross Proceeds in Each PEA after Round
97 (sum across all categories)
Excess or Net Demand (Demand-Supply) in Each PEA after Round
97:
(across all categories in each PEA)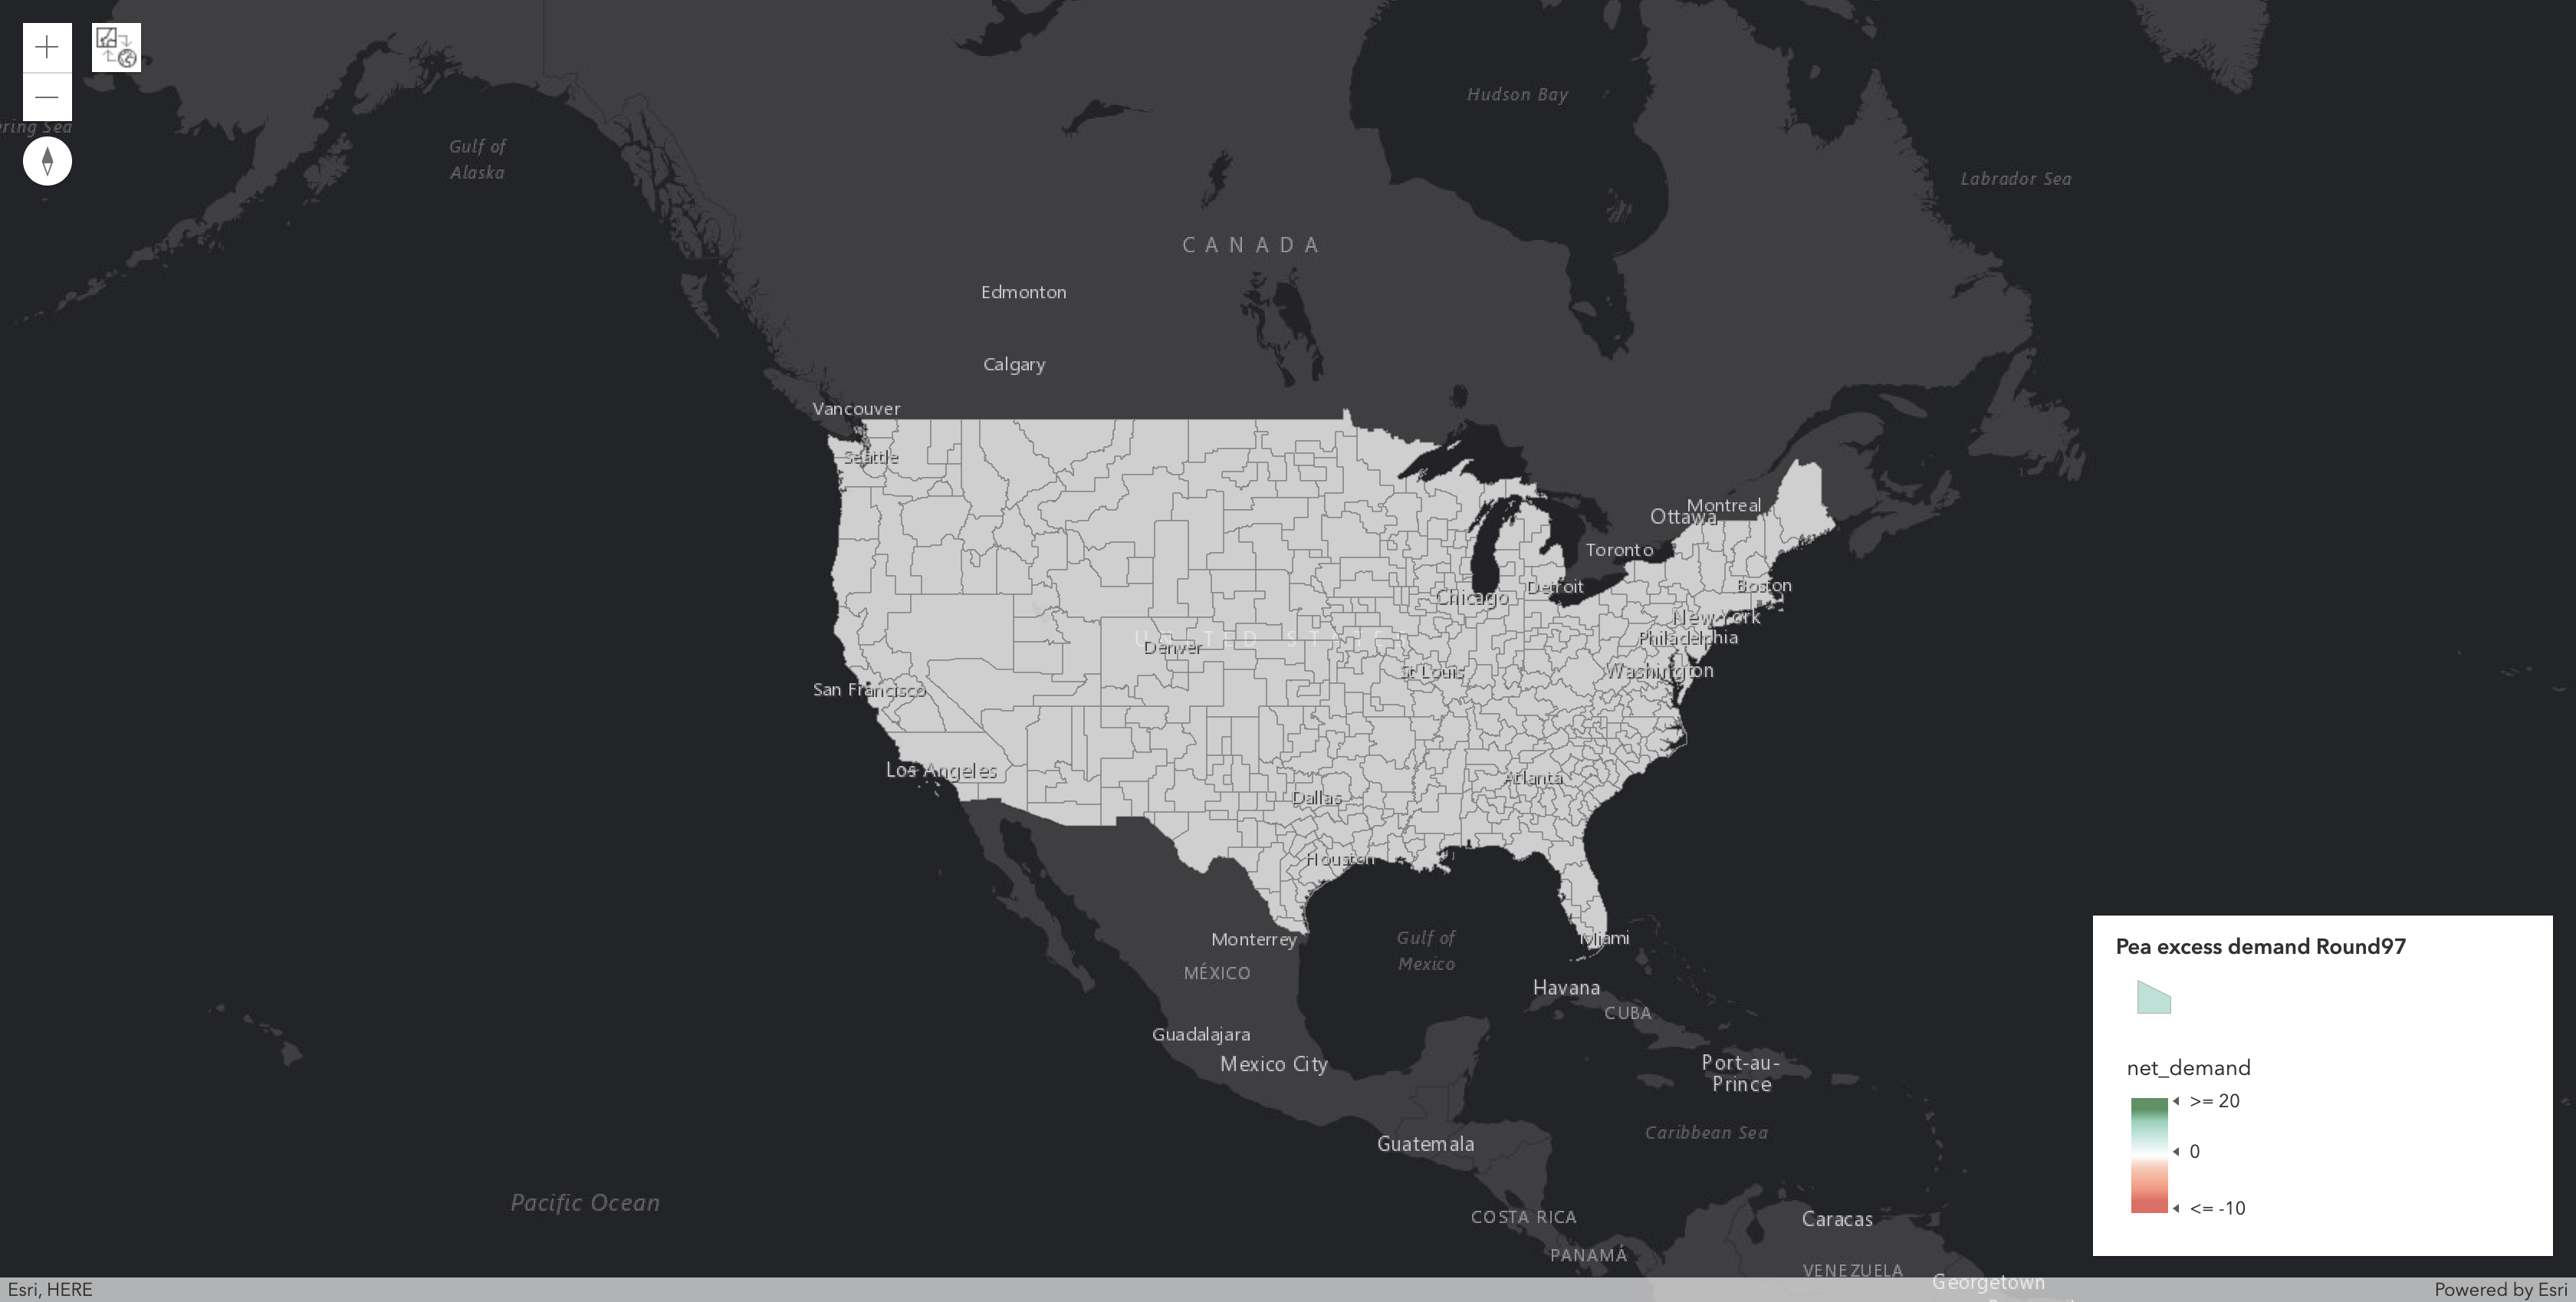
(across all categories in each PEA)

Change in Demand in Round
97 from Prior Round in Each PEA:
(across all categories in each PEA)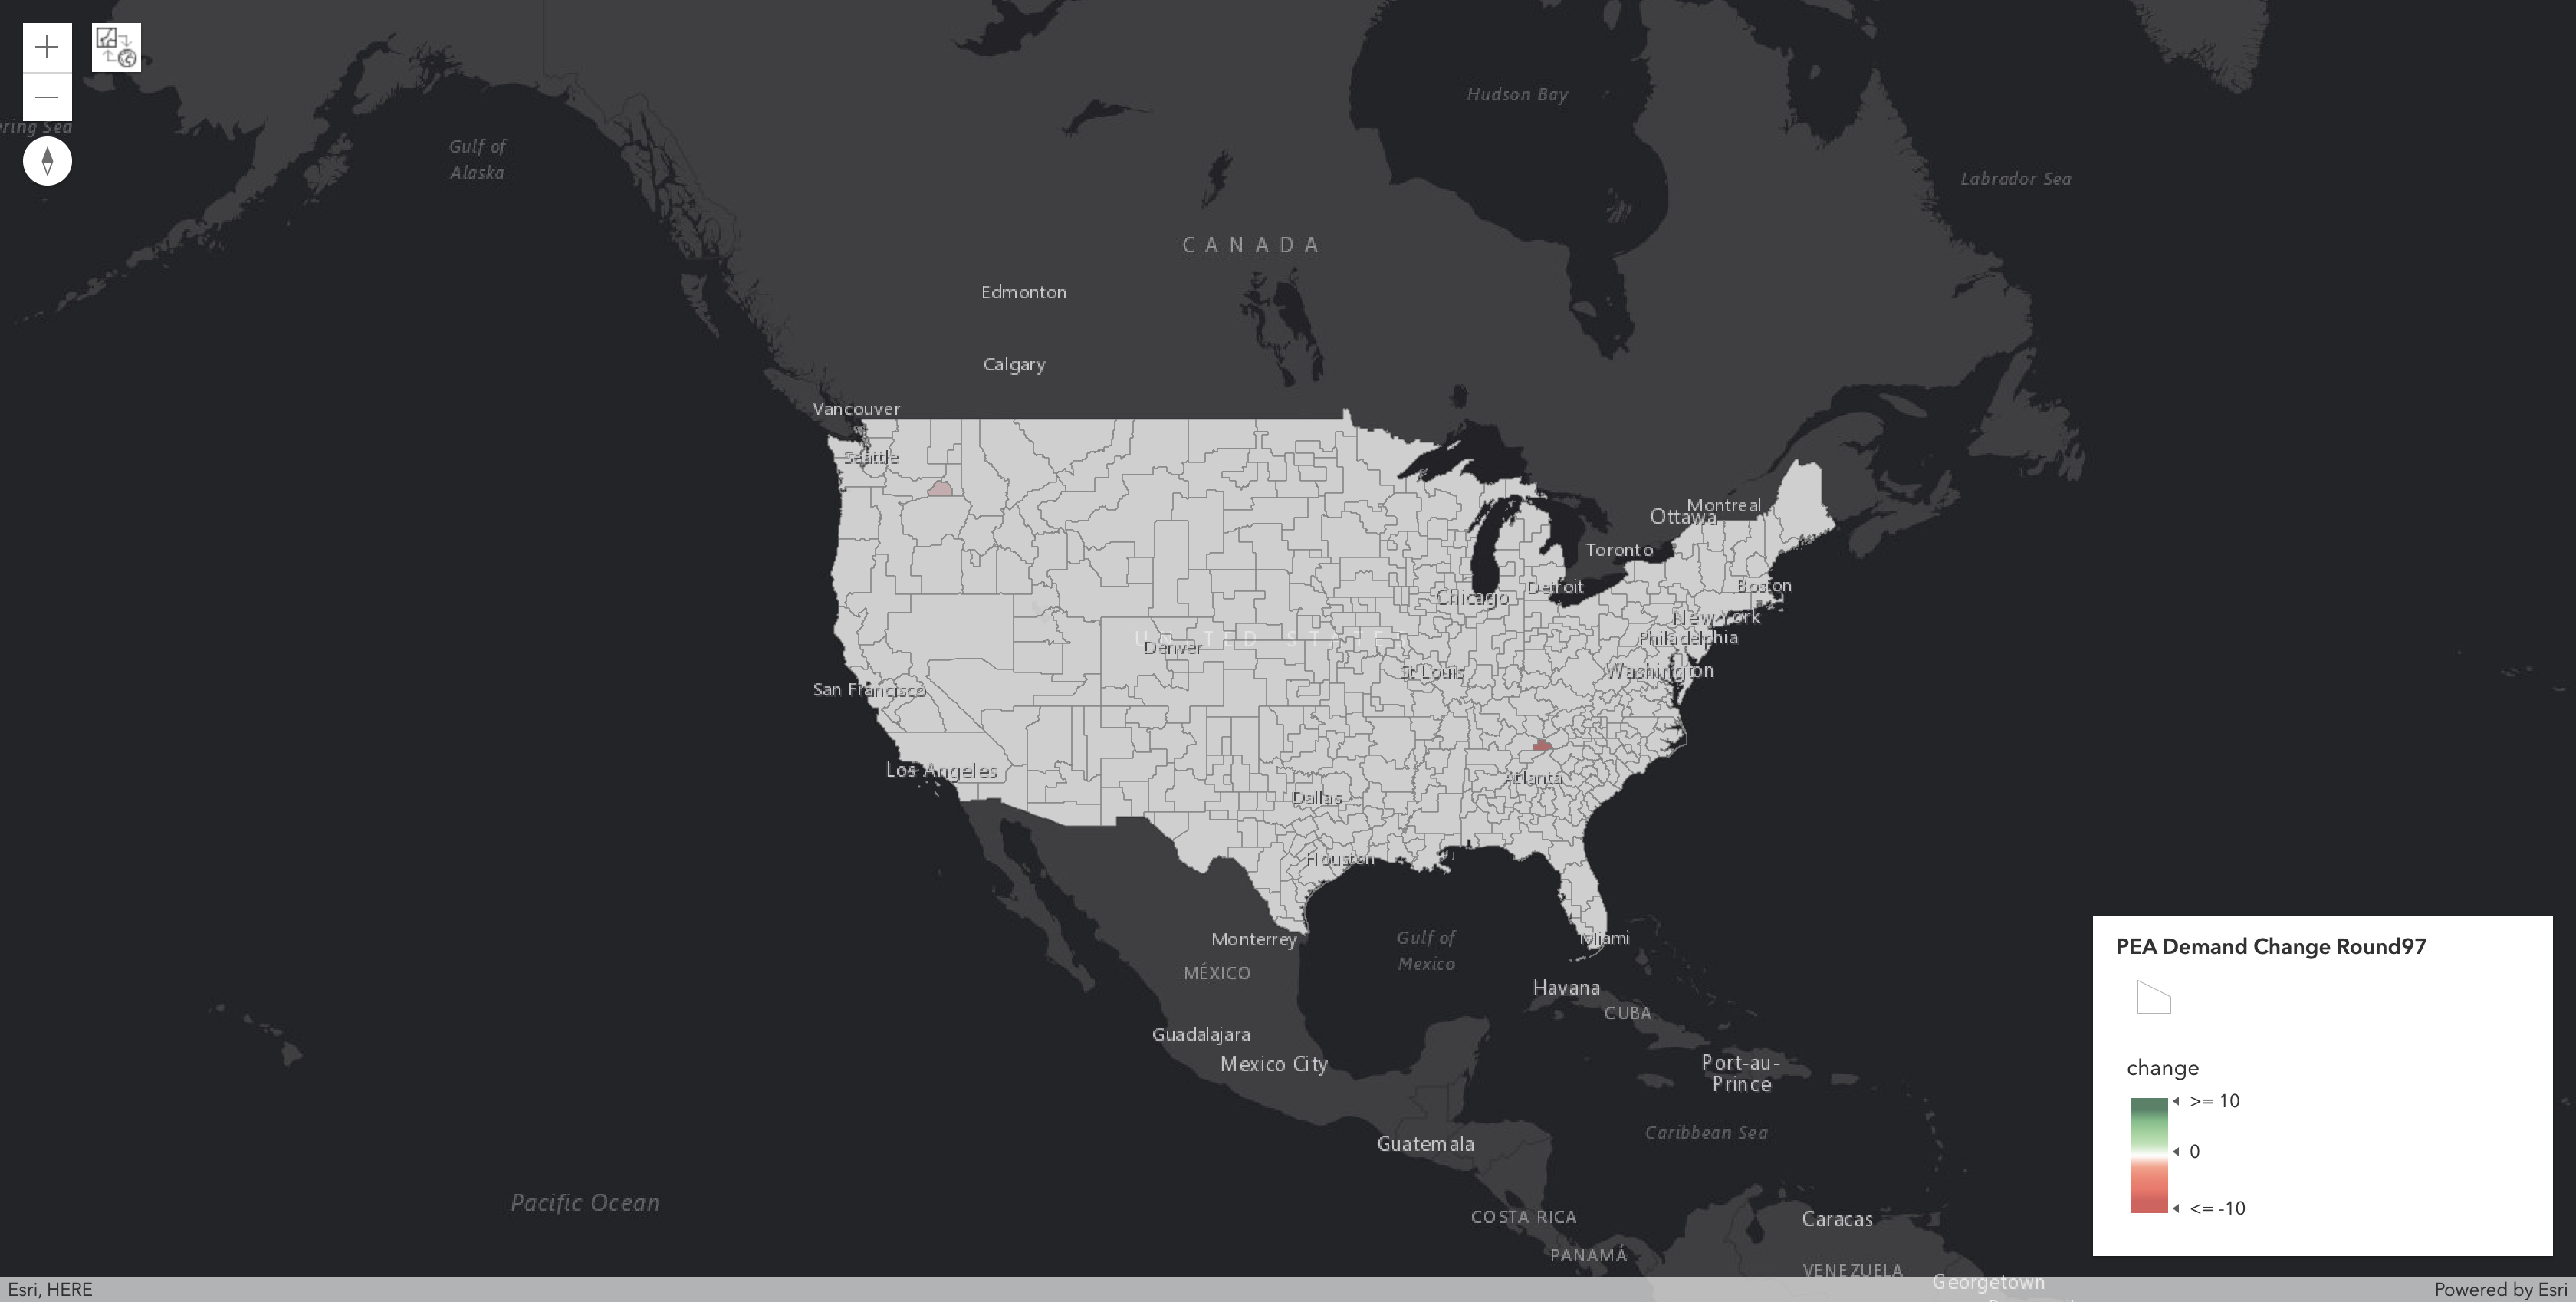
(across all categories in each PEA)

20 PEAs with the Largest Excess Demand after Round
97:
(across all categories in each PEA)
(across all categories in each PEA)
| market_number | market_name | aggregate_demand | supply | excess_demand |
|---|---|---|---|---|
| PEA001 | New York, NY | 14 | 14 | 0 |
| PEA271 | Elmira, NY | 14 | 14 | 0 |
| PEA281 | Muskogee, OK | 14 | 14 | 0 |
| PEA280 | Garden City, KS | 14 | 14 | 0 |
| PEA279 | Logan, UT | 14 | 14 | 0 |
| PEA278 | Bartlesville, OK | 14 | 14 | 0 |
| PEA277 | Hutchinson, KS | 14 | 14 | 0 |
| PEA276 | Rapid City, SD | 14 | 14 | 0 |
| PEA275 | Corsicana, TX | 14 | 14 | 0 |
| PEA274 | Twin Falls, ID | 14 | 14 | 0 |
| PEA273 | Bloomington, IL | 14 | 14 | 0 |
| PEA272 | Brownwood, TX | 14 | 14 | 0 |
| PEA270 | Ottawa, IL | 14 | 14 | 0 |
| PEA257 | Cheyenne, WY | 14 | 14 | 0 |
| PEA269 | Racine, WI | 14 | 14 | 0 |
| PEA268 | Clinton, IA | 14 | 14 | 0 |
| PEA267 | Sheboygan, WI | 14 | 14 | 0 |
| PEA266 | Lenoir, NC | 14 | 14 | 0 |
| PEA265 | Winona, MN | 14 | 14 | 0 |
| PEA263 | Santa Fe, NM | 14 | 14 | 0 |
20 PEAs with Largest Absolute Change in Demand after Round
97
from Prior Round:
(across all categories in each PEA)
from Prior Round:
(across all categories in each PEA)
| market_number | market_name | aggregate_demand | demand_change |
|---|---|---|---|
| PEA346 | Franklin, NC | 14 | -6 |
| PEA373 | Walla Walla, WA | 14 | -2 |
Change in Aggregate Demand for All PEAs by Round: (across all categories in each PEA)
(Double click on legend to switch to a different PEA)
(Double click on legend to switch to a different PEA)
20 PEAs with Largest Absolute Change in Demand in Category A after Round
97 from Prior Round:
| market_number | market_name | category | aggregate_demand | demand_change |
|---|
20 PEAs with Largest Absolute Change in Demand in Category BC after Round
97 from Prior Round:
| market_number | market_name | category | aggregate_demand | demand_change |
|---|
20 PEAs with Largest Absolute Change in Demand in Category ABC after Round
97 from Prior Round:
| market_number | market_name | category | aggregate_demand | demand_change |
|---|---|---|---|---|
| PEA346 | Franklin, NC | ABC | 14 | -6 |
| PEA373 | Walla Walla, WA | ABC | 14 | -2 |
Tracking Auction 107's Progress Toward Completion after Round 97:
NOTE: Because the prior nonlogarithmic chart is somewhat skewed by the large excess demand in the early rounds, we have repeated the chart above taking the log (base 10) of the values on both axeses:
NOTE: This next chart looks at changes in excess demand in dollars after removing the impact of round price increases. Please note negative scale.
Comparing Auction 107's Progress to Prior FCC Auctions after Round 97:
The chart below tracks auction progress (using the metric of excess demand as a percent of aggregate demand) against other recent prior FCC auctions.
NOTE: Any comparison between Auction 97 (the AWS-3 auction and an SMRA auction) and the other auctions shown (which are all clock auctions) needs several important caveats. SMRAs have a fundamentally different structures from clocks auctions (e.g., SMRAs allow bidders to bid for specific licenses whereas in clock auctions you bid for generic blocks; SMRAs determine provisional winners after reach round whereas clock auctions just determine aggregate demand at the end of each round). Participants in an SMRA also face different rules regarding the exiting of accepted bid (e.g., a provisionally winning bidder in an SMRA is allowed to submit a withdrawal bid subject to a withdrawal penalty whereas in a clock auction a bidder may not withdraw a bid once demand equals supply). Finally, in SMRAs, bidders do not need to affirmatively bid in every round for licenses that they have provisionally won as they will have an opportunity to bid again in the next round if their provisionally winning bid is outbid in the current round. These differences make any direct comparisons difficult. Nevertheless, with all these caveats in mind and using a simple moving average to “smooth” the variations in demand that you see from round-to-round in an SMRA, I thought that it might still be interesting to make a comparison between Auction 97 and this auction.
NOTE: Any comparison between Auction 97 (the AWS-3 auction and an SMRA auction) and the other auctions shown (which are all clock auctions) needs several important caveats. SMRAs have a fundamentally different structures from clocks auctions (e.g., SMRAs allow bidders to bid for specific licenses whereas in clock auctions you bid for generic blocks; SMRAs determine provisional winners after reach round whereas clock auctions just determine aggregate demand at the end of each round). Participants in an SMRA also face different rules regarding the exiting of accepted bid (e.g., a provisionally winning bidder in an SMRA is allowed to submit a withdrawal bid subject to a withdrawal penalty whereas in a clock auction a bidder may not withdraw a bid once demand equals supply). Finally, in SMRAs, bidders do not need to affirmatively bid in every round for licenses that they have provisionally won as they will have an opportunity to bid again in the next round if their provisionally winning bid is outbid in the current round. These differences make any direct comparisons difficult. Nevertheless, with all these caveats in mind and using a simple moving average to “smooth” the variations in demand that you see from round-to-round in an SMRA, I thought that it might still be interesting to make a comparison between Auction 97 and this auction.
Fun: Comparing Current PEA Prices to Predicted Prices Based on Prior FCC Auctions after Round
97:
Deals Following Round 97: Most Underpriced PEAs (Above 1 Million in Population) Relative to their Predicted Price:
In the bubble graph below, we attempt to track how current PEA prices (on a price per MHz pop basis) compare to their "Predicted Price" based on past FCC auctions. To accomplish this comparison, we need to introduce the concept of the "Overprice Ratio". This Overprice Ratio is the current price of each PEA divided by the Predicted Price for that PEA.
This Predicted Price for any PEA is calculated by first classifying each PEA into its relevant REAG (an FCC licensing schema that divides the country into 6 regions) and then identifying a "Reference Market" for that REAG. Typically, the Reference Market for each REAG is the largest PEA by population (with the exception of the Southeast REAG where we selected Atlanta as its Reference Market rather than Washington DC, which we have reclassified as being in the Northeast REAG). For those PEAs that are Reference Markets, we use the New York PEA (the "Nationwide Reference Market") as their Reference Market. We then take the current price for each Reference Market and multiply it by the historical ratio of auction prices between each PEA and its Reference Market to get the Predicted Price.
The y-axis on the left shows the log (base 10) of the "Overprice Ratio." We take the log of the Overprice Ratio to lessen the impact of outliers. By definition, the New York PEA (shown in the graph as the biggest bubble in dark blue below), as the Nationwide Reference Market, will always remain at y=0 (the horizontal green line in the graph below).
In addition, the x-axis shows aggregate demand in each PEA after the latest round. There is a vertical green line where aggregate demand equals 14. This the maximum number of licenses available for sale in eac PEA. Thus, if the bubble shows up to the right of this green vertical line, aggregate demand in this PEA is greater than supply. Also, the y-axis on the right side of the graph tracks the current price for New York PEA after the latest round and is adjusted so that New York PEA's price always remains on the green horizontal line in the graph below. Finally, the bubbles representing the PEAs are sized based on population and color-coded based on the PEA that they fall in.
Example:
Pick San Diego. Its Reference Market is Los Angeles.
Suppose
San Diego current aggregate demand = 10
San Diego current price (average across categories) = $0.50
Los Angeles current price (average across categories) = $0.75
Historical ratio (San Diego/Los Angeles) = 1.09784
Compute
San Diego current Predicted Price = $0.75 * 1.09784 = $0.82338
San Diego Overprice Ratio = $0.50 / $0.82338 = 0.607253
San Diego logarithmic-scaled Overprice Ratio = Log10(0.607253) = -0.21663
Interpretation
In the logarithmic-scaled chart below, San Diego is represented by a bubble with coordinates (x,y) = (10,-0.21663). That means San Diego is underpriced. All bubbles with negative values are underpriced; conversely, all bubbles with positive values are overpriced with respect to their Reference Market's current price. Before the Reference Market's price converges, any underpriced PEA is a valid prediction due to the non-decreasing price property; however, the converse may not be true until the Reference Market's price converges.
To get the complete list of Reference Markets, Predicted Prices and Overprice Ratios for any PEA see the Table below.
Deals Following Round 97: Most Underpriced PEAs (Above 1 Million in Population) Relative to their Predicted Price:
| Market Number | Market Name | Population | Aggregate Demand | Supply | Bidding Units | Ave. Current Price MHz Pop (for PEA) | Reference Market | Reference Market Name | Predicted Price (for PEA) | Overprice Ratio (Log Base 10) |
|---|---|---|---|---|---|---|---|---|---|---|
| PEA038 | Milwaukee, WI | 1,555,908 | 14 | 14 | 46,700 | $2.086550 | PEA003 | Chicago, IL | $3.184116 | -0.183560 |
| PEA009 | Miami, FL | 6,291,880 | 14 | 14 | 188,800 | $1.548623 | PEA011 | Atlanta, GA | $1.911639 | -0.091460 |
| PEA018 | San Diego, CA | 3,095,313 | 14 | 14 | 92,900 | $1.773020 | PEA002 | Los Angeles, CA | $1.946501 | -0.040541 |
| PEA013 | Orlando, FL | 4,562,642 | 14 | 14 | 136,900 | $0.960657 | PEA011 | Atlanta, GA | $1.038127 | -0.033682 |
| PEA002 | Los Angeles, CA | 19,410,169 | 14 | 14 | 582,300 | $1.344487 | PEA001 | New York, NY | $1.441436 | -0.030239 |
| PEA010 | Houston, TX | 5,891,999 | 14 | 14 | 176,800 | $1.345919 | PEA008 | Dallas, TX | $1.332368 | 0.004395 |
| PEA039 | Oklahoma City, OK | 1,446,527 | 14 | 14 | 43,400 | $1.769386 | PEA008 | Dallas, TX | $1.723951 | 0.011298 |
| PEA003 | Chicago, IL | 9,366,713 | 14 | 14 | 281,000 | $1.100623 | PEA001 | New York, NY | $1.031450 | 0.028190 |
| PEA029 | Jacksonville, FL | 1,918,264 | 14 | 14 | 57,500 | $1.042990 | PEA011 | Atlanta, GA | $0.956648 | 0.037528 |
| PEA021 | Tampa, FL | 2,783,243 | 14 | 14 | 83,500 | $1.467440 | PEA011 | Atlanta, GA | $1.337619 | 0.040228 |
| PEA015 | Phoenix, AZ | 3,817,117 | 14 | 14 | 114,500 | $1.690720 | PEA002 | Los Angeles, CA | $1.503714 | 0.050906 |
| PEA028 | San Antonio, TX | 1,999,689 | 14 | 14 | 60,000 | $1.043412 | PEA008 | Dallas, TX | $0.897884 | 0.065235 |
| PEA008 | Dallas, TX | 6,452,472 | 14 | 14 | 193,600 | $1.619091 | PEA001 | New York, NY | $1.379476 | 0.069557 |
| PEA005 | Baltimore, MD-Washington, DC | 7,842,134 | 14 | 14 | 235,300 | $1.235652 | PEA001 | New York, NY | $1.025639 | 0.080902 |
| PEA043 | Charlotte, NC | 1,327,006 | 14 | 14 | 39,800 | $1.423098 | PEA011 | Atlanta, GA | $1.148449 | 0.093123 |
| PEA045 | Raleigh, NC | 1,302,381 | 14 | 14 | 39,100 | $1.461076 | PEA011 | Atlanta, GA | $1.178498 | 0.093344 |
| PEA030 | Kansas City, MO | 1,810,075 | 14 | 14 | 54,300 | $1.041634 | PEA001 | New York, NY | $0.839497 | 0.093696 |
| PEA020 | Denver, CO | 2,789,669 | 14 | 14 | 83,700 | $1.239217 | PEA008 | Dallas, TX | $0.937844 | 0.121017 |
| PEA040 | Birmingham, AL | 1,399,686 | 14 | 14 | 42,000 | $1.462691 | PEA011 | Atlanta, GA | $1.105570 | 0.121566 |
| PEA035 | Austin, TX | 1,628,809 | 14 | 14 | 48,900 | $1.351147 | PEA008 | Dallas, TX | $1.005719 | 0.128226 |
BONUS VIDEO: Review Round-by-Round Bidding with Video Showing Change in Demand for Round 1 through Round 97:
BONUS VIDEO 2 : Review Round-by-Round Bidding with Video Showing in 3D Gross Proceeds for Round 1 through Round 97:
NOTE: In this video, Category A proceeds are represented by the blue bars, Category BC proceeds are represented by the violet bars and Category C are represented by the green bars.
Download to Excel or View Details on All PEAs After Round
97:
Selected PEA Details
| Market Number | Market Name | Category | Population | Bidding Units | Supply | Aggregate Demand | Excess Demand | Demand Change | Posted Price | Gross Proceeds | Price Per MHz POP (for product) | Fully Loaded Price Per MHz POP (for product) | Price Per MHz POP (for PEA) | Reference Market Number | Reference Market Name | Predicted Price (for PEA) | Overprice Ratio (Log Base10) |
|---|
