Auction 105 Summary (3550-3650 MHz Band)
| Gross Proceeds after Round 76: | $4,585,663,345 |
| Qualified Bidders (Clock Phase): | 271 |
| Products with Supply < Demand after Round 76: | 0 |
| Products with Supply = Demand after Round 76: | 2545 |
| Products with Supply > Demand after Round 76: | 688 |
|
Products with No Demand after Round
76: (subset of Products with Supply > Demand) |
13 |
| Total Unsold Blocks after Round 76: | 2006 |
| Largest County (by Population) with Demand Change after Round 76: | Benton, TN |
| Nationwide Price Per MHz-POP at the end of Round 76: | $0.216921 |
**Check out new SEARCH feature below that allows you to get round specific data for any county!**
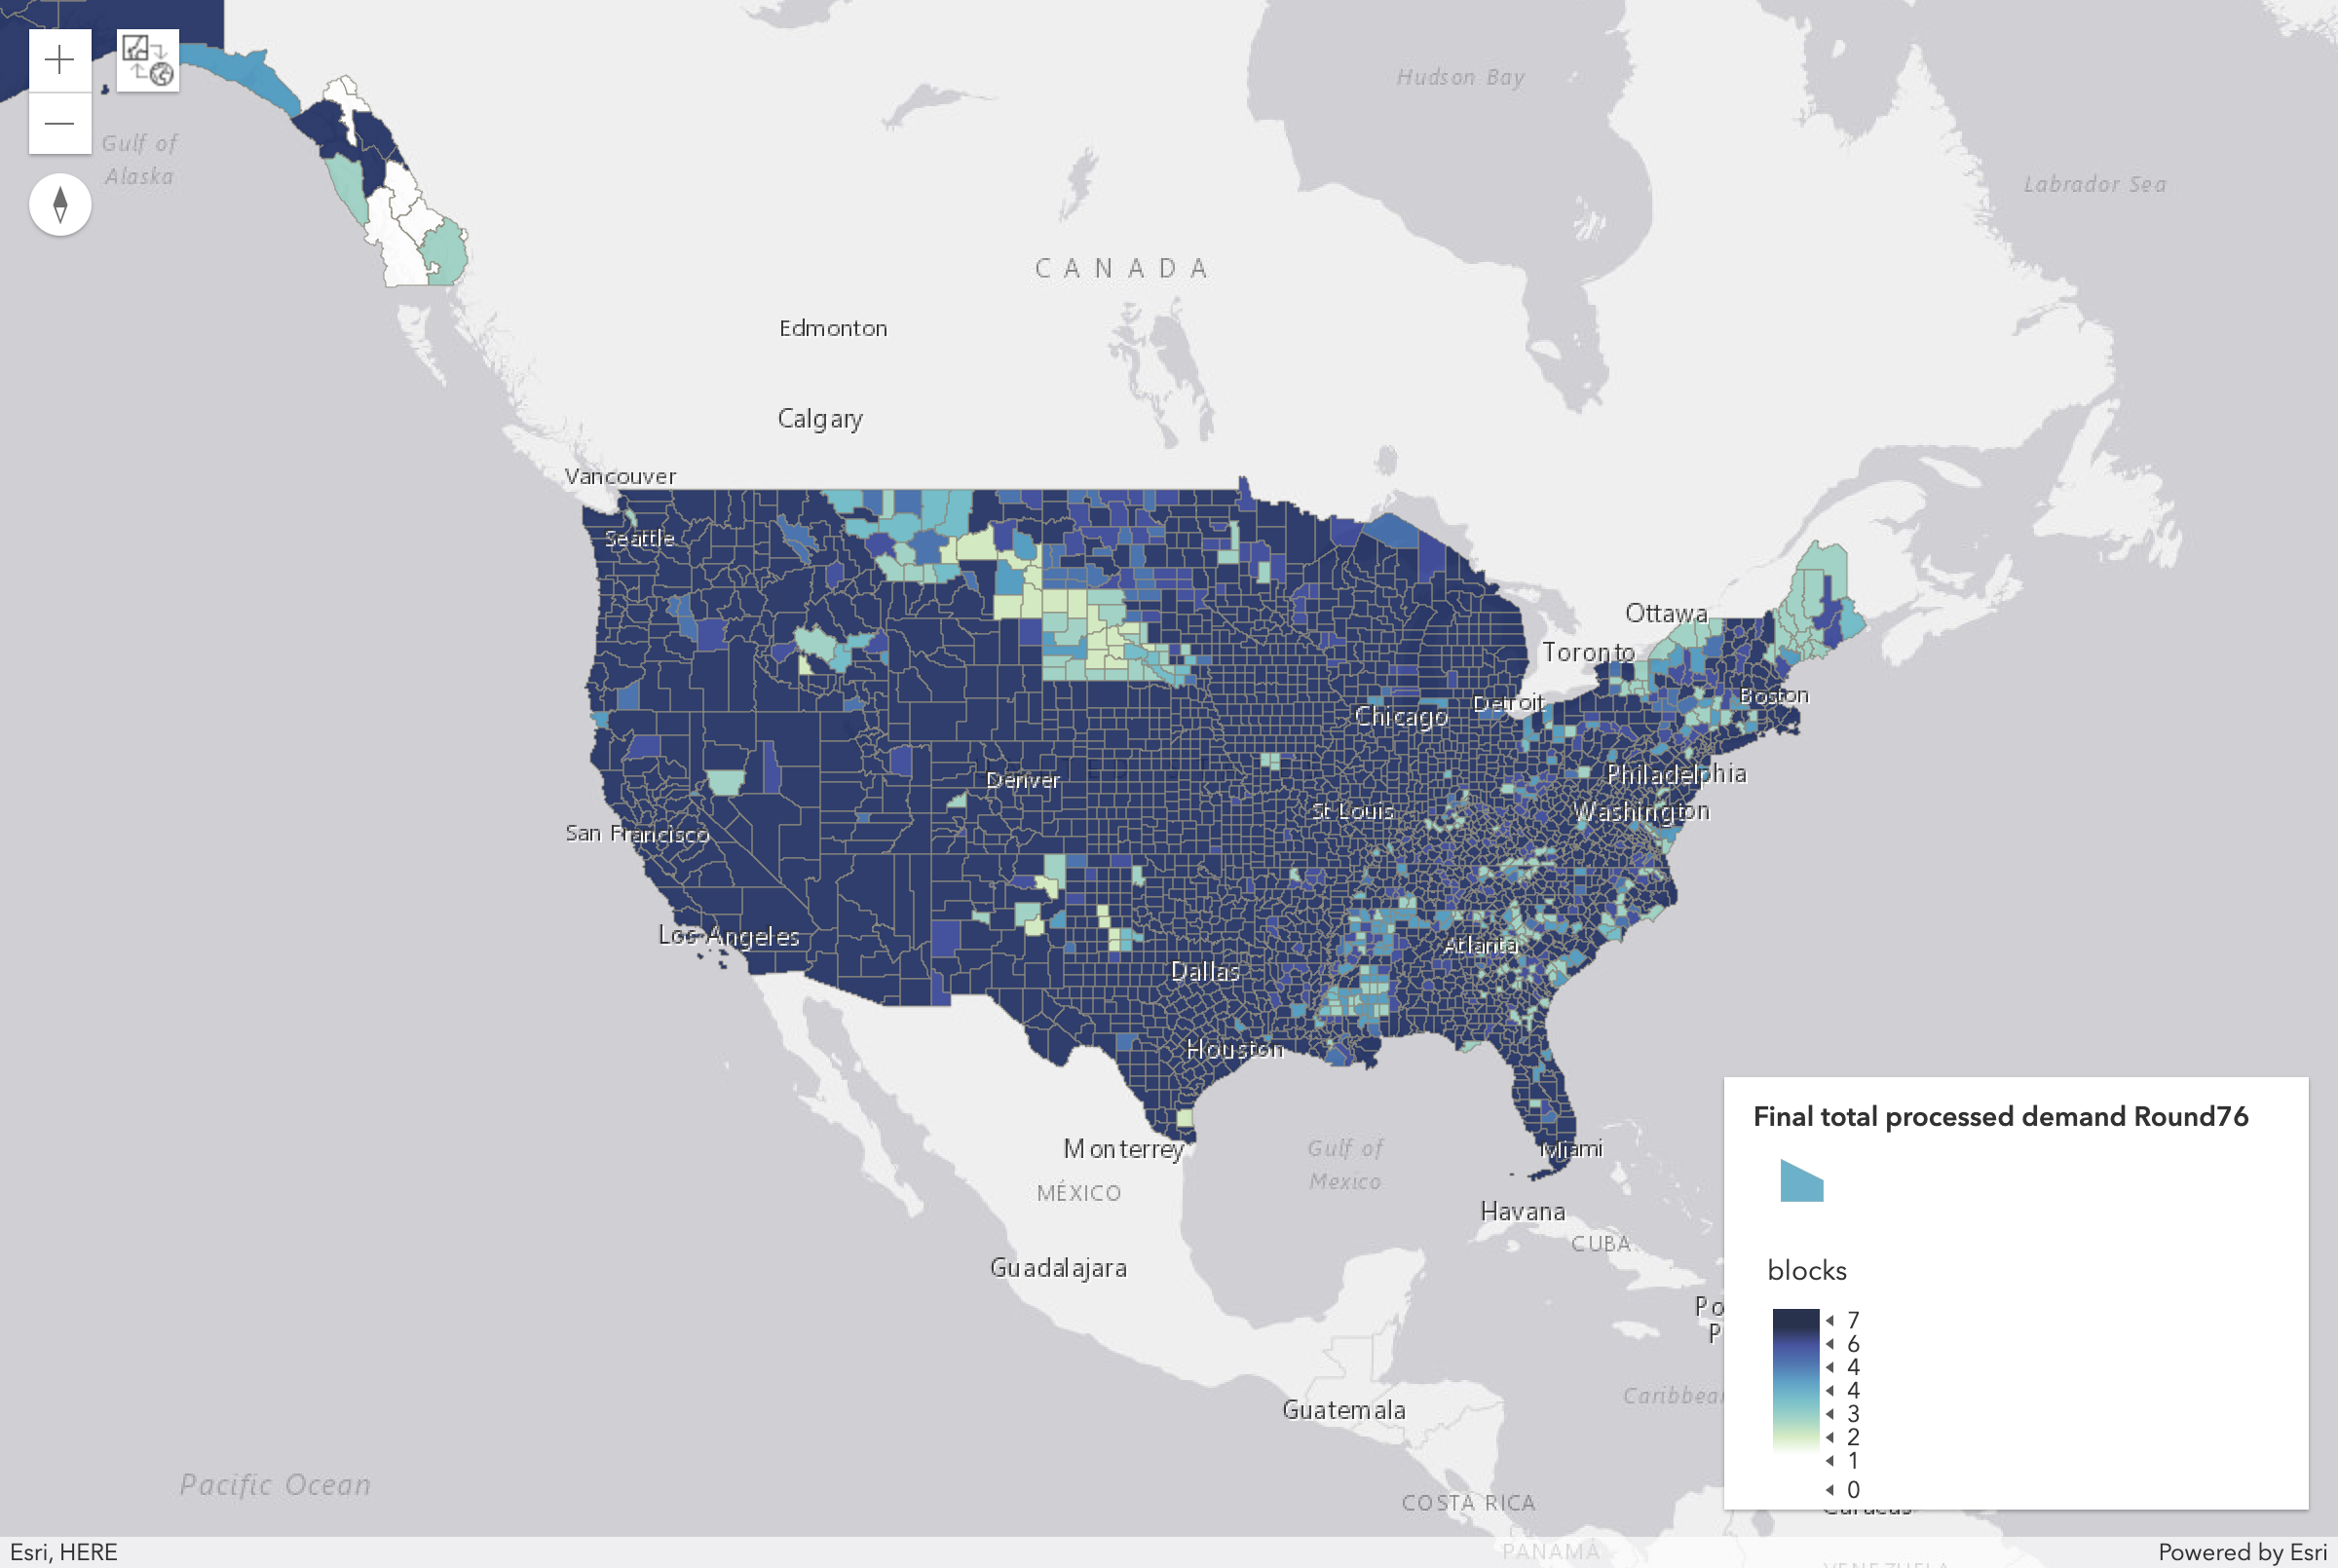
Final Processed Demand after Round 76:

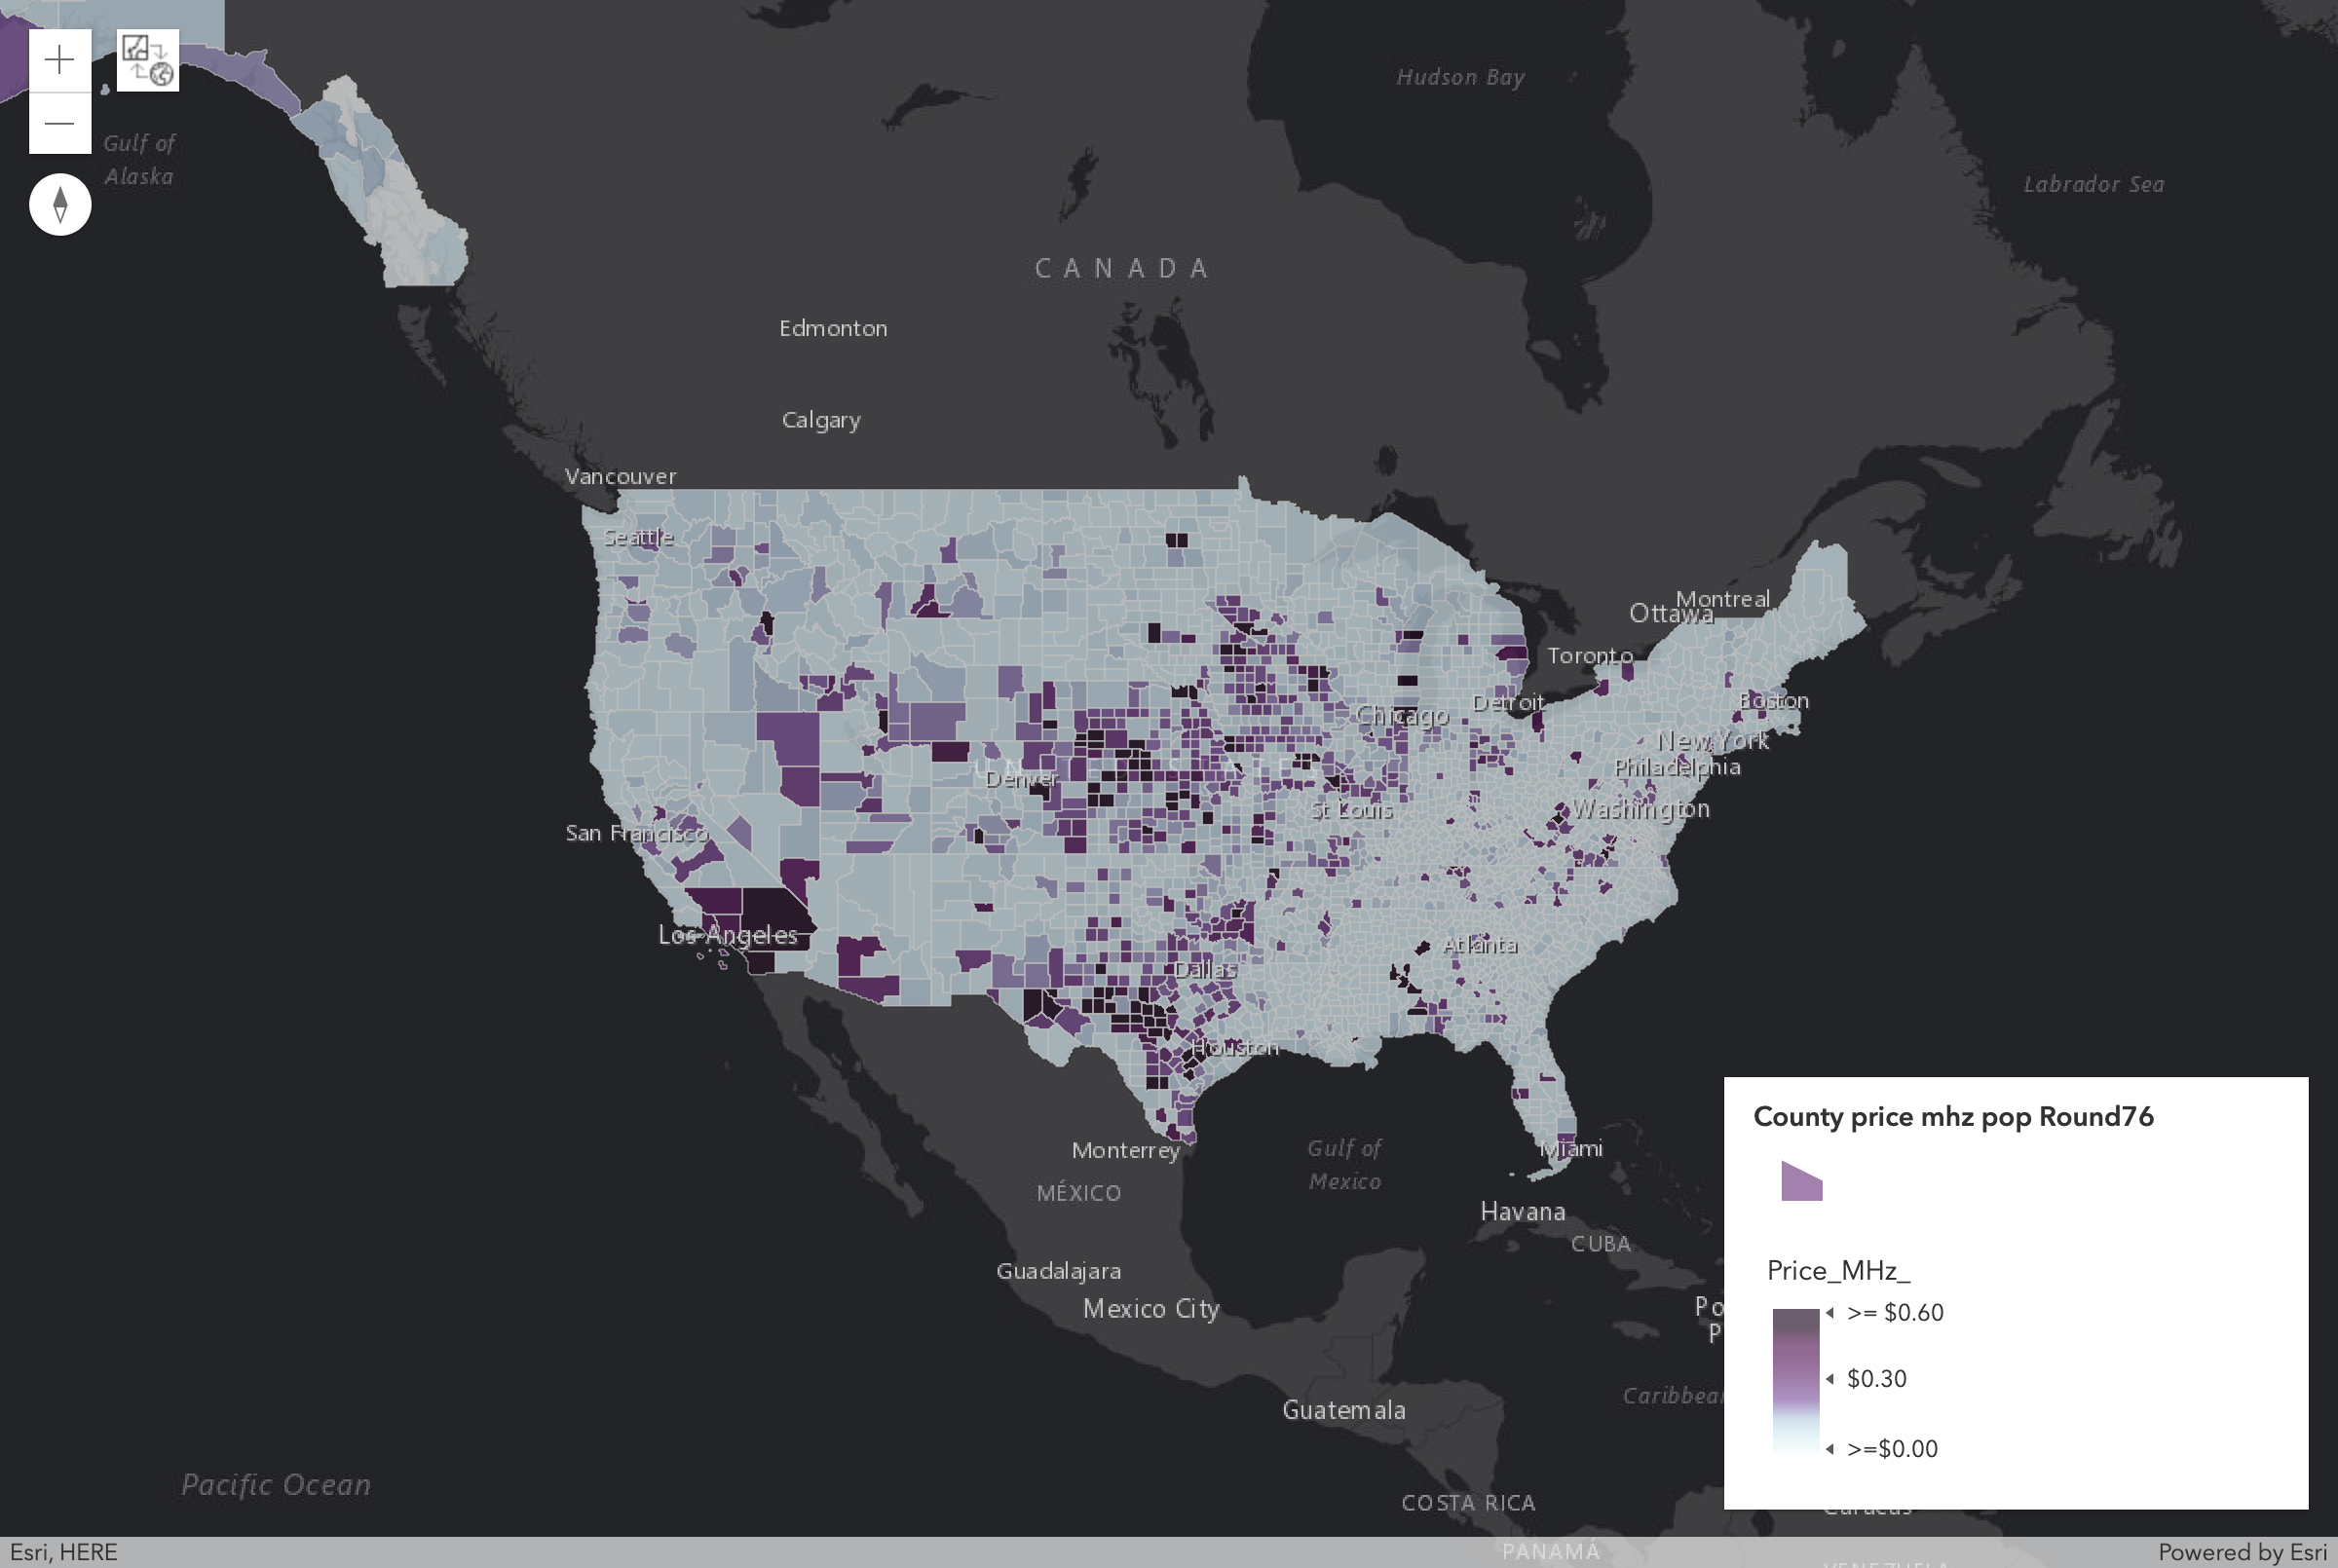
Price Per MHz POP in Each County after Round 76:

Price Per MHz-POP in Top 20 Counties (by Population) after Round 76:
| county | county_name | census_id | population | supply | aggregate_demand | posted_price | gross_proceeds | price_mhz_pop |
|---|---|---|---|---|---|---|---|---|
| CA-037 | Los Angeles, CA | 06037 | 9,818,605 | 7 | 7 | $52,071,881 | $364,503,167 | $0.530339 |
| IL-031 | Cook, IL | 17031 | 5,194,675 | 7 | 7 | $39,853,840 | $278,976,880 | $0.767206 |
| TX-201 | Harris, TX | 48201 | 4,092,459 | 7 | 7 | $19,134,000 | $133,938,000 | $0.467543 |
| AZ-013 | Maricopa, AZ | 04013 | 3,817,117 | 7 | 7 | $17,830,000 | $124,810,000 | $0.467106 |
| CA-073 | San Diego, CA | 06073 | 3,095,313 | 7 | 7 | $21,203,340 | $148,423,380 | $0.685014 |
| CA-059 | Orange, CA | 06059 | 3,010,232 | 7 | 7 | $27,449,000 | $192,143,000 | $0.911857 |
| NY-047 | Kings, NY | 36047 | 2,504,700 | 7 | 7 | $15,627,000 | $109,389,000 | $0.623907 |
| FL-086 | Miami-Dade, FL | 12086 | 2,496,435 | 7 | 7 | $8,782,000 | $61,474,000 | $0.351782 |
| TX-113 | Dallas, TX | 48113 | 2,368,139 | 7 | 7 | $9,189,000 | $64,323,000 | $0.388026 |
| NY-081 | Queens, NY | 36081 | 2,230,722 | 7 | 7 | $12,680,127 | $88,760,889 | $0.568432 |
| CA-065 | Riverside, CA | 06065 | 2,189,641 | 7 | 7 | $13,954,000 | $97,678,000 | $0.637273 |
| CA-071 | San Bernardino, CA | 06071 | 2,035,210 | 7 | 7 | $12,912,000 | $90,384,000 | $0.634431 |
| NV-003 | Clark, NV | 32003 | 1,951,269 | 7 | 7 | $9,148,000 | $64,036,000 | $0.468823 |
| WA-033 | King, WA | 53033 | 1,931,249 | 7 | 7 | $4,222,000 | $29,554,000 | $0.218615 |
| MI-163 | Wayne, MI | 26163 | 1,820,584 | 7 | 7 | $4,827,000 | $33,789,000 | $0.265135 |
| TX-439 | Tarrant, TX | 48439 | 1,809,034 | 7 | 7 | $7,028,000 | $49,196,000 | $0.388495 |
| CA-085 | Santa Clara, CA | 06085 | 1,781,642 | 7 | 7 | $3,551,000 | $24,857,000 | $0.199311 |
| FL-011 | Broward, FL | 12011 | 1,748,066 | 7 | 7 | $5,615,300 | $39,307,100 | $0.321229 |
| TX-029 | Bexar, TX | 48029 | 1,714,773 | 7 | 7 | $7,335,000 | $51,345,000 | $0.427753 |
| NY-061 | New York, NY | 36061 | 1,585,873 | 7 | 7 | $9,939,000 | $69,573,000 | $0.626721 |
Top 20 Counties by Price Per MHz-POP after Round 76:
| county | county_name | census_id | population | supply | aggregate_demand | posted_price | gross_proceeds | price_mhz_pop |
|---|---|---|---|---|---|---|---|---|
| TX-301 | Loving, TX | 48301 | 82 | 7 | 7 | $116,000 | $812,000 | $141.463415 |
| HI-005 | Kalawao, HI | 15005 | 90 | 7 | 7 | $7,200 | $50,400 | $8.000000 |
| MO-199 | Scotland, MO | 29199 | 4,843 | 7 | 7 | $187,000 | $1,309,000 | $3.861243 |
| NE-049 | Deuel, NE | 31049 | 1,941 | 7 | 7 | $70,000 | $490,000 | $3.606388 |
| MO-045 | Clark, MO | 29045 | 7,139 | 7 | 7 | $227,000 | $1,589,000 | $3.179717 |
| AL-131 | Wilcox, AL | 01131 | 11,670 | 7 | 7 | $368,000 | $2,576,000 | $3.153385 |
| NE-073 | Gosper, NE | 31073 | 2,044 | 7 | 7 | $63,000 | $441,000 | $3.082192 |
| MN-101 | Murray, MN | 27101 | 8,725 | 7 | 7 | $250,001 | $1,750,007 | $2.865341 |
| PR-049 | Culebra, PR | 72049 | 1,818 | 7 | 7 | $51,001 | $357,007 | $2.805336 |
| NE-027 | Cedar, NE | 31027 | 8,852 | 7 | 7 | $227,000 | $1,589,000 | $2.564392 |
| KS-181 | Sherman, KS | 20181 | 6,010 | 7 | 7 | $154,000 | $1,078,000 | $2.562396 |
| CO-115 | Sedgwick, CO | 08115 | 2,379 | 7 | 7 | $56,999 | $398,993 | $2.395923 |
| KS-153 | Rawlins, KS | 20153 | 2,519 | 7 | 7 | $57,000 | $399,000 | $2.262803 |
| TX-283 | La Salle, TX | 48283 | 6,886 | 7 | 7 | $154,000 | $1,078,000 | $2.236422 |
| VA-013 | Arlington, VA | 51013 | 207,627 | 7 | 7 | $4,565,120 | $31,955,840 | $2.198712 |
| AL-065 | Hale, AL | 01065 | 15,760 | 7 | 7 | $334,000 | $2,338,000 | $2.119289 |
| TX-235 | Irion, TX | 48235 | 1,599 | 7 | 7 | $33,000 | $231,000 | $2.063790 |
| NE-083 | Harlan, NE | 31083 | 3,423 | 7 | 7 | $63,000 | $441,000 | $1.840491 |
| KS-199 | Wallace, KS | 20199 | 1,485 | 7 | 7 | $26,999 | $188,993 | $1.818114 |
| TN-027 | Clay, TN | 47027 | 7,861 | 7 | 7 | $140,000 | $980,000 | $1.780944 |
Top 10 States by Price per MHz-POP (average of counties in the state) after Round 76:
| state_abbreviation | population | supply | aggregate_demand | price_mhz_pop |
|---|---|---|---|---|
| DC | 601,723 | 7 | 7 | $1.029773 |
| CA | 37,253,956 | 406 | 402 | $0.424682 |
| IL | 12,830,632 | 714 | 708 | $0.377437 |
| NV | 2,700,551 | 119 | 110 | $0.360040 |
| AZ | 6,392,017 | 105 | 105 | $0.348081 |
| HI | 1,360,301 | 35 | 35 | $0.326045 |
| NY | 19,378,102 | 434 | 315 | $0.297877 |
| TX | 25,145,561 | 1,778 | 1,722 | $0.277617 |
| RI | 1,052,567 | 35 | 35 | $0.258325 |
| AL | 4,779,736 | 469 | 441 | $0.237361 |
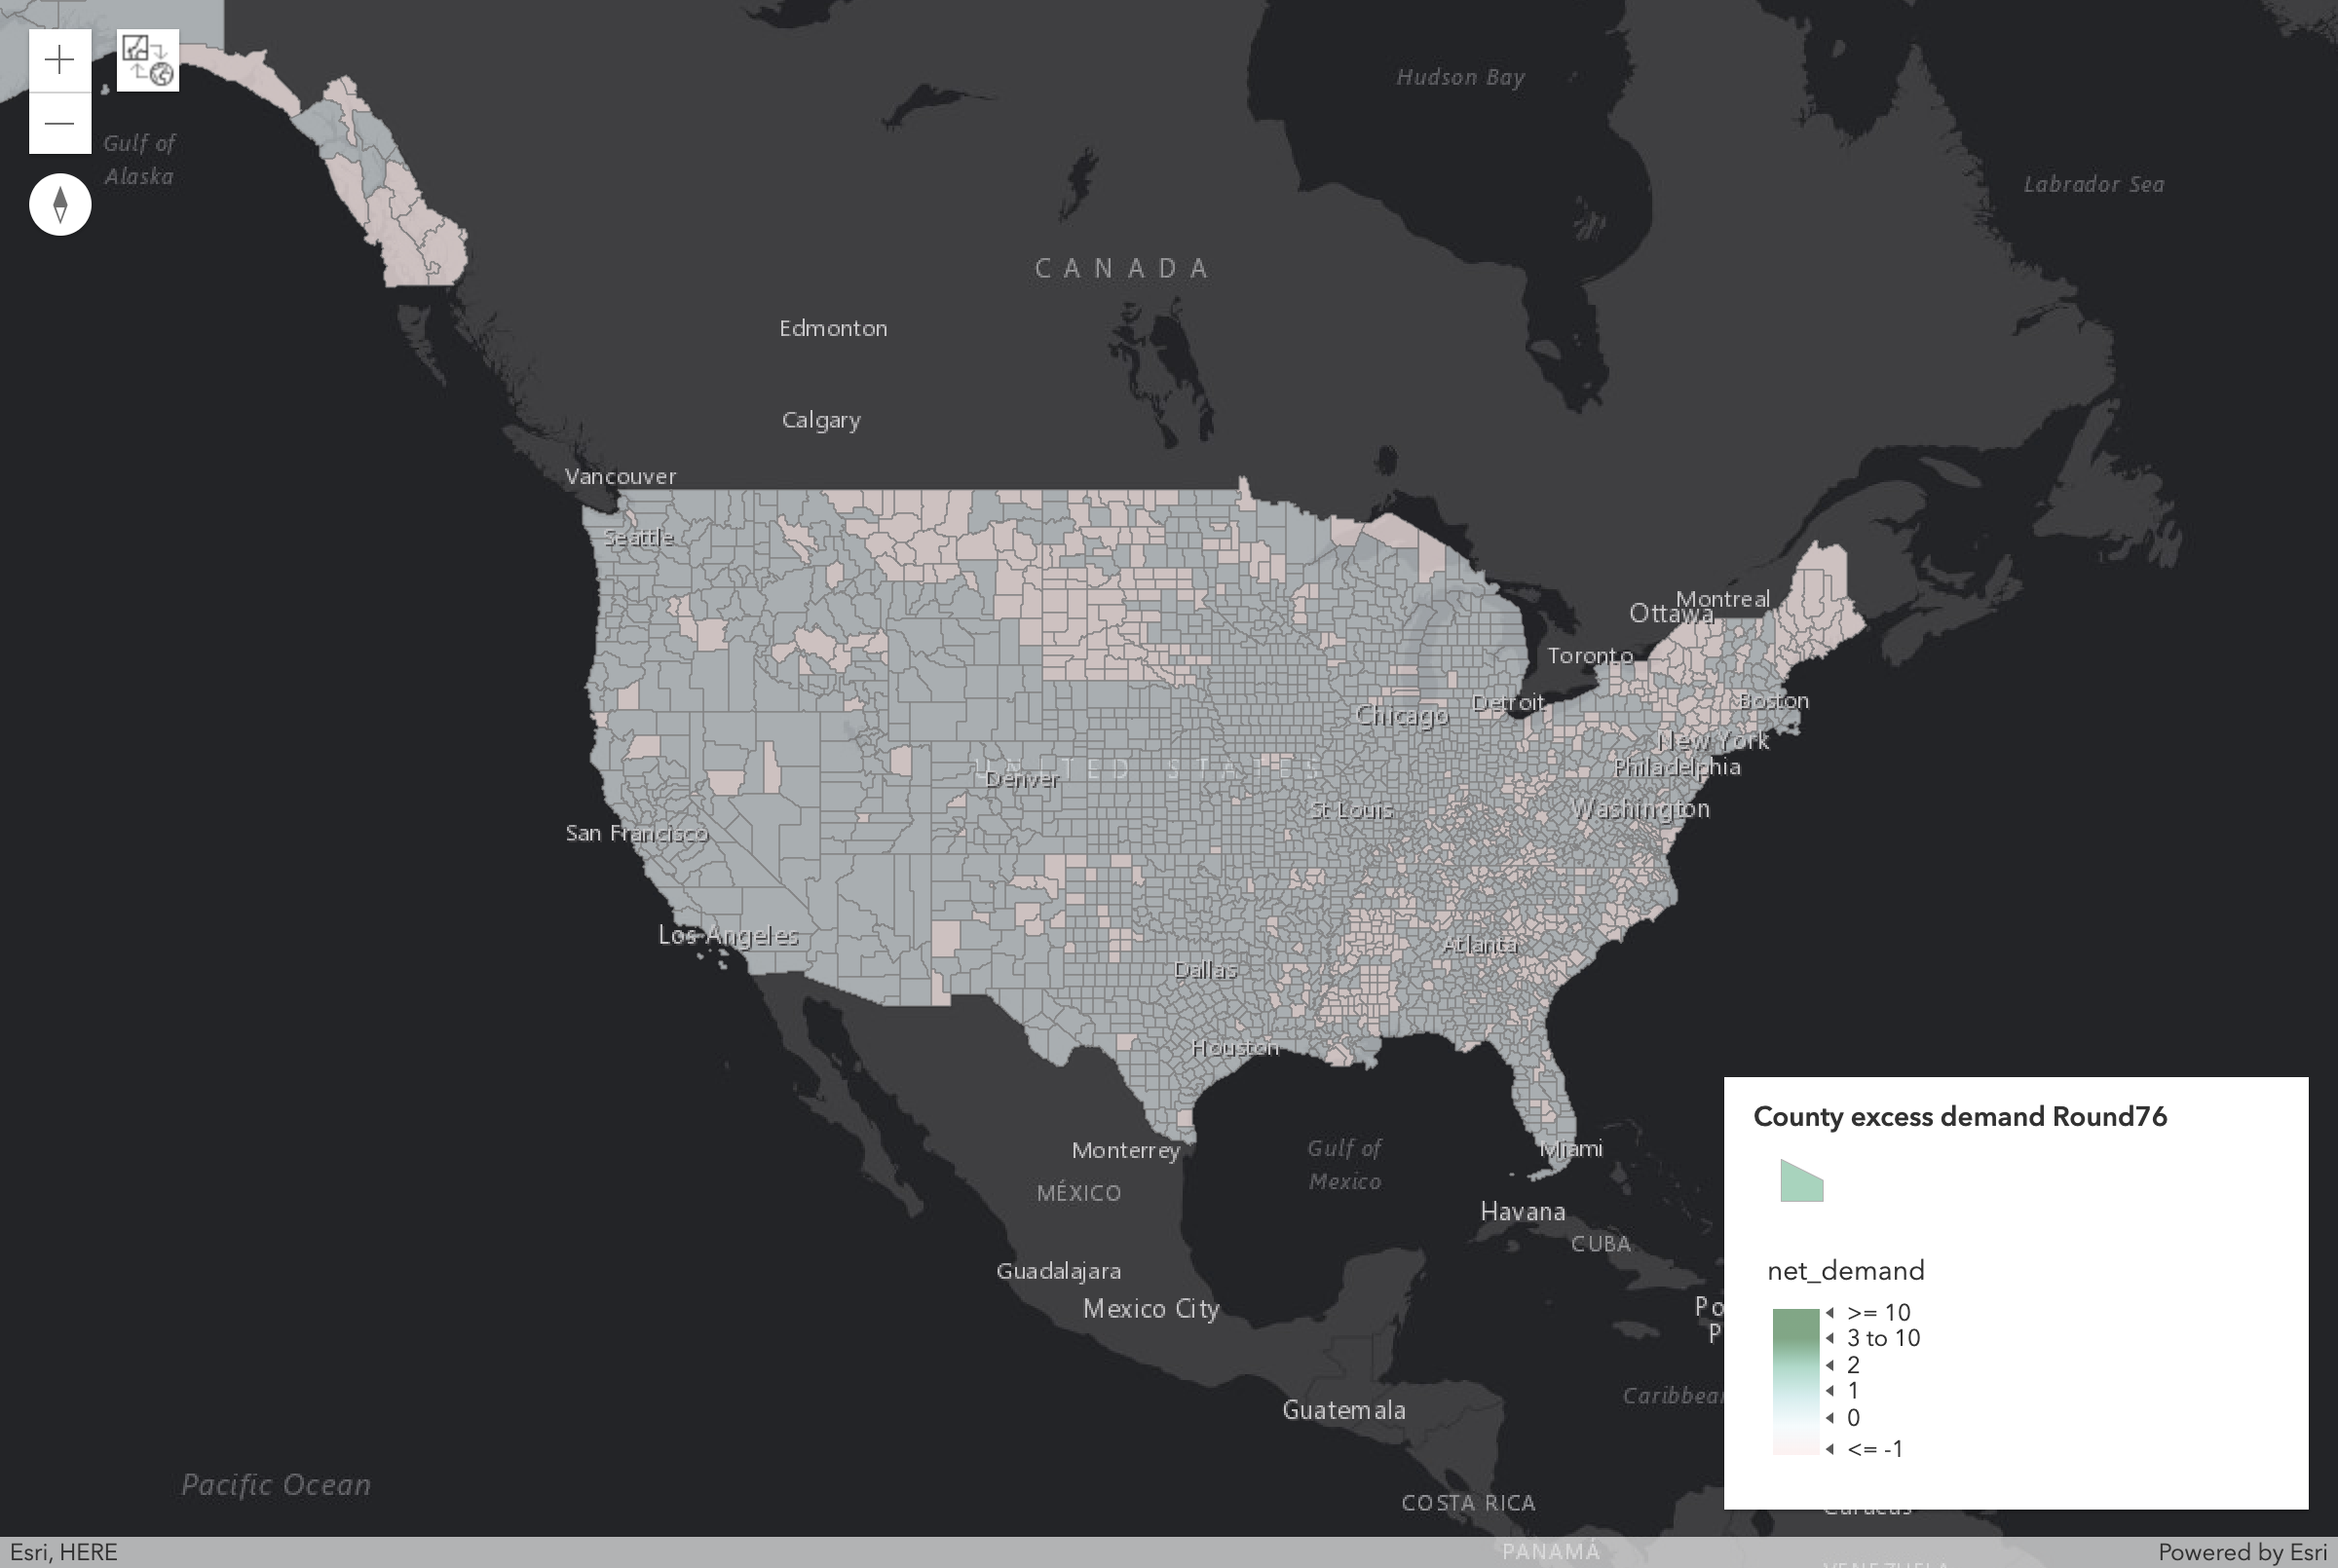
Excess or Net Demand (Demand-Supply) in Each PEA after Round 76:

20 Counties with the Largest Excess Demand after Round 76:
| county | county_name | census_id | population | supply | aggregate_demand | excess_demand |
|---|
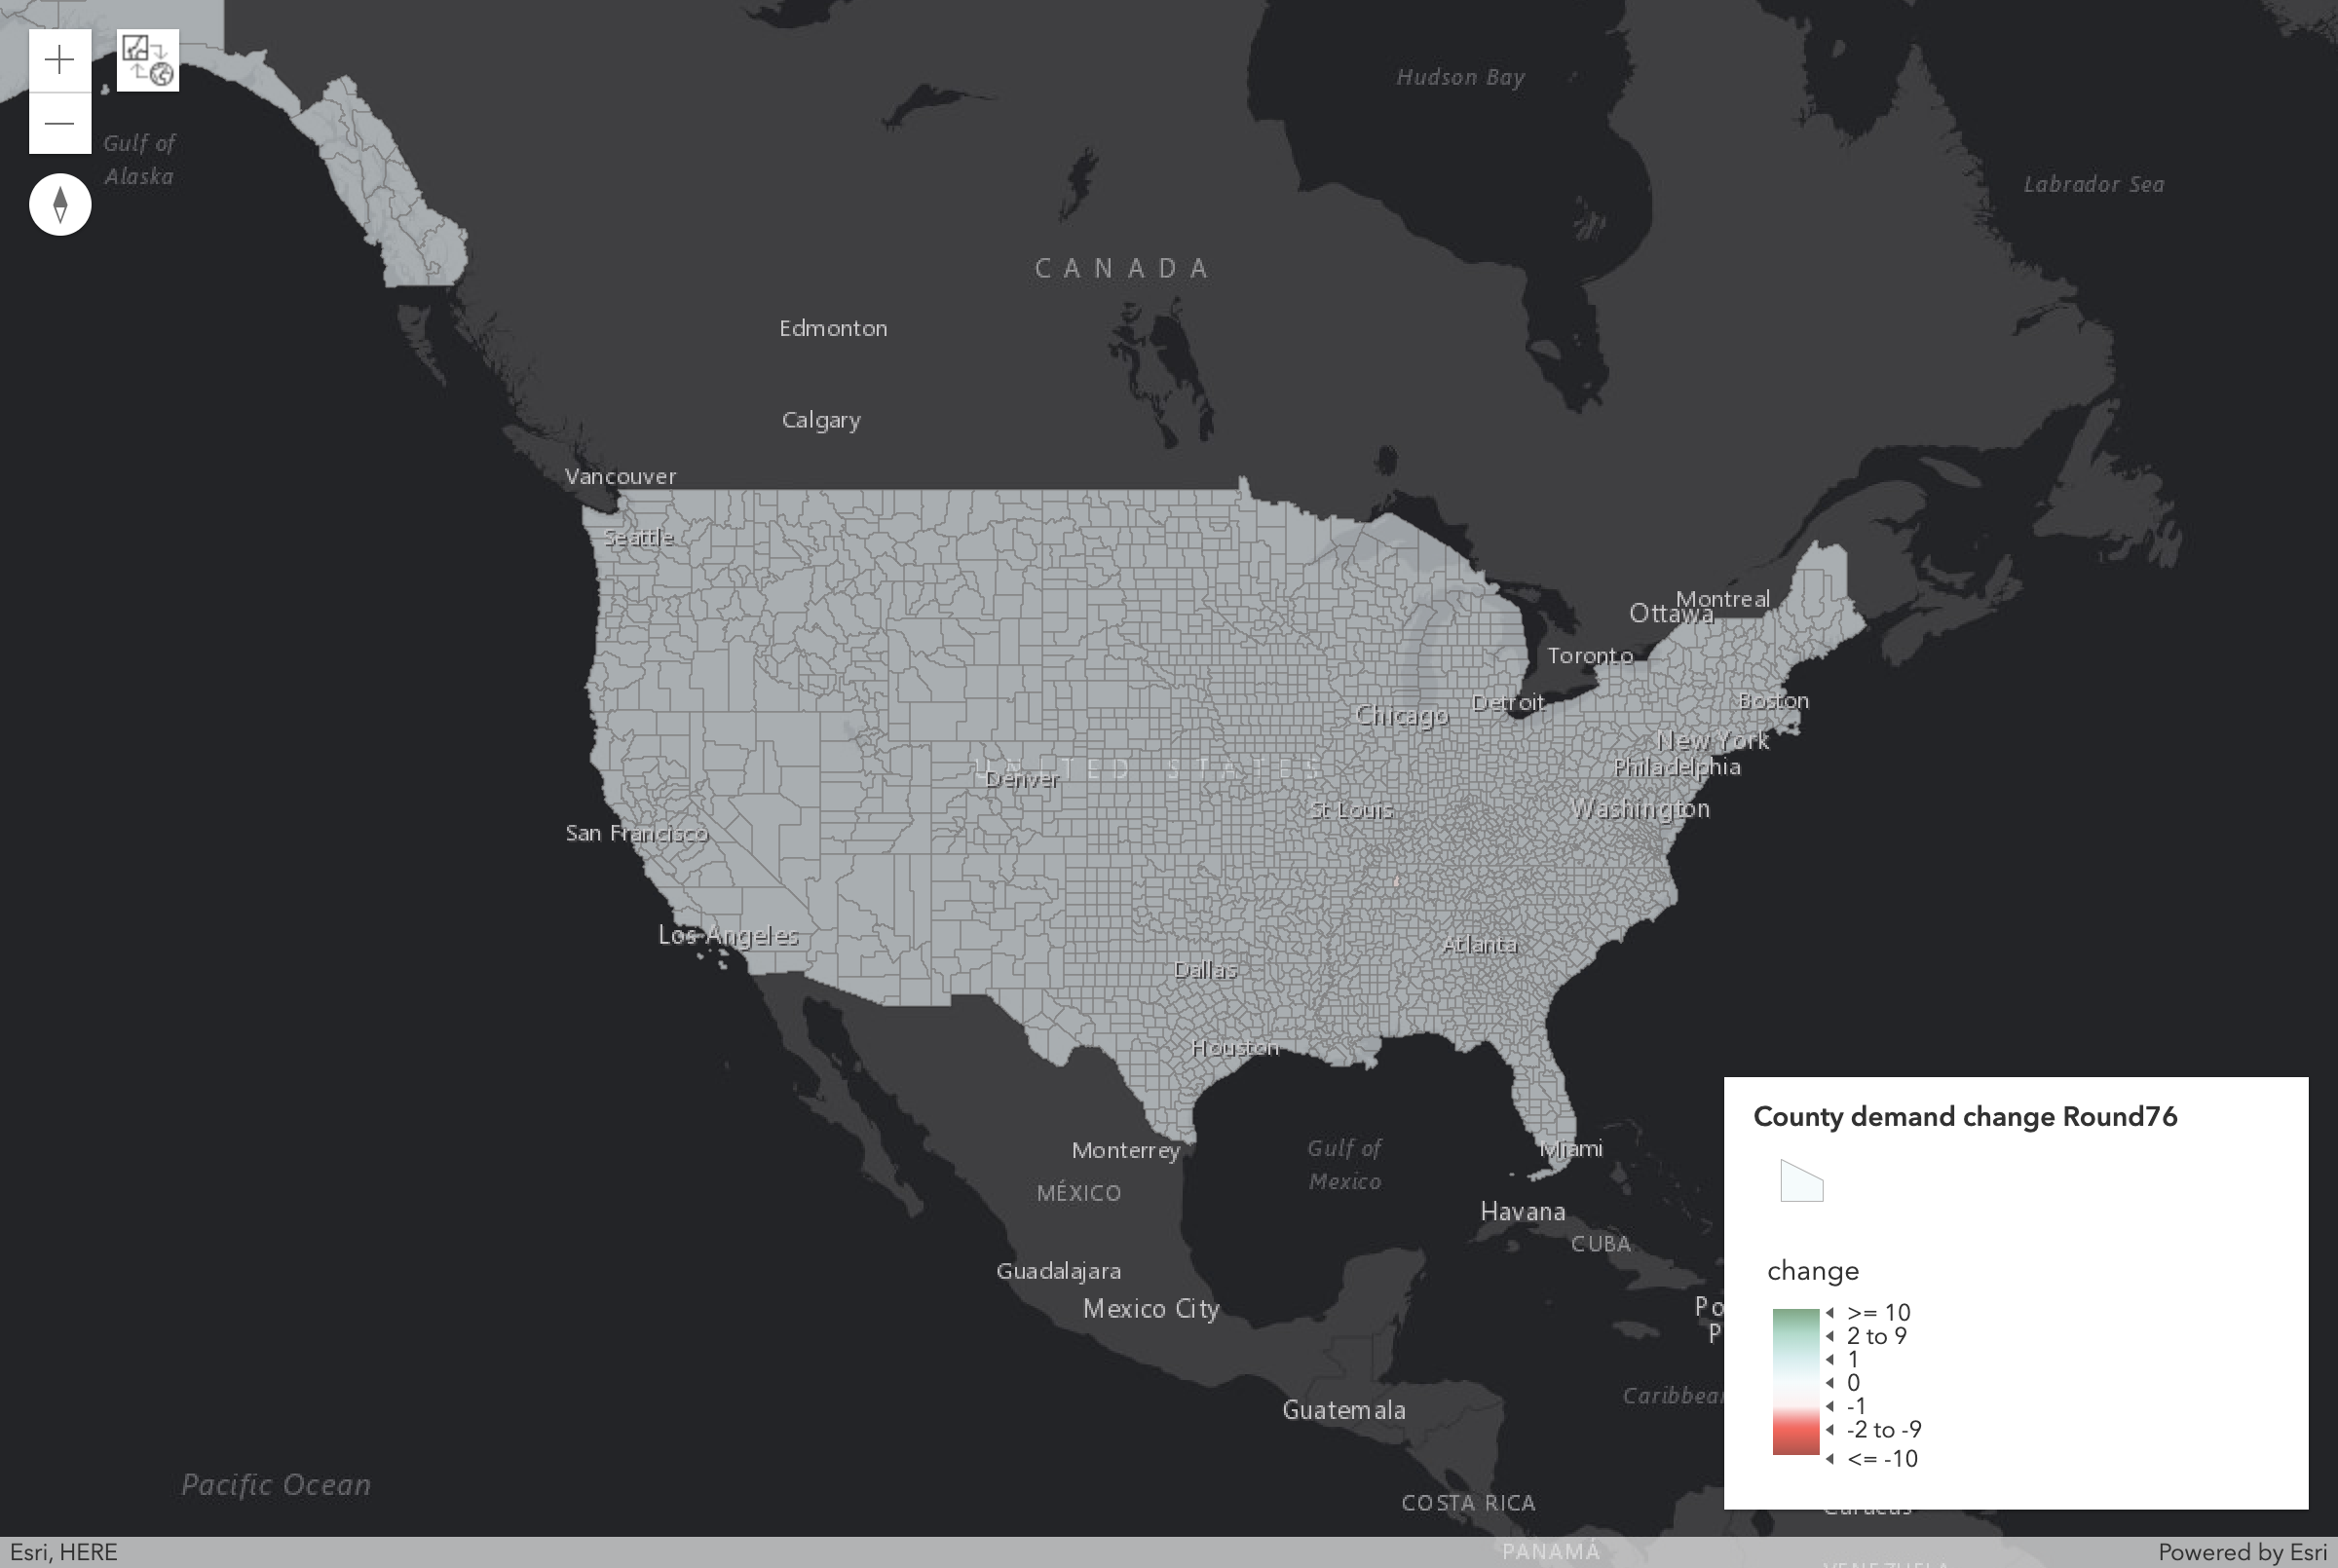
Change in Demand in Round 76 from Prior Round in Each PEA:

20 Counties with Largest Absolute Change in Demand after Round 76 from Prior Round:
| county | county_name | census_id | aggregate_demand | demand_change |
|---|---|---|---|---|
| TN-005 | Benton, TN | 47005 | 7 | -1 |
Change in Aggregate Demand for the Top 100 Counties (by population) by Round:
(Double click on legend to switch to a different county)
Tracking Auction 105's Progress Toward Completion after Round 76:
NOTE: Because the prior chart is somewhat skewed by the large excess demand in the early rounds, we have repeated the chart above taking the log (base 10) of the values on both axeses:
The chart below tracks auction progress (using the metric of excess demand as a percent of aggregate demand) against other recent prior FCC auctions.
Fun: Comparing Current County Prices to Predicted Prices Based on Prior FCC Auctions after Round 76:
In the graph below, the y-axis on the left shows the log (base 10) of the "Overprice Ratio." This Overprice Ratio is the current price of a county against the predicted price for that county. This predicted price is calculated by multiplying the current price of Los Angeles against the historical ratio of auction prices between that county and Los Angeles. We take the log of this ratio so that an Overprice Ratio of one (meaning the predicted price matches the current price perfectly) ends up at zero on the left y-axis. By definition, Los Angeles (shown in the graph as the biggest circle in yellow above), will always remain at y=0 (the horizontal green line in the graph below).
The x-axis shows aggregate demand after the latest round. The y-axis on the right side of the graph tracks the current price for Los Angeles County after the latest round and is adjusted so that Los Angeles County's price always remains on the green horizontal line in the graph below. Finally, the circles representing the counties are sized based on population and color-coded based on the PEA that they fall in.
For more information on this graph see my article on Linkedin.
Deals Following Round 76: Most Underpriced Counties (Above 800K in Population):
| County | County Name | Census ID | Population | Bidding Units | Supply | Aggregate Demand | Current Price MHz POP | Predicted Price | Overprice Ratio (Log Base 10) |
|---|---|---|---|---|---|---|---|---|---|
| NJ-023 | Middlesex, NJ | 34023 | 809,858 | 8,100 | 7 | 7 | $0.047799 | $0.567708 | -1.074710 |
| CT-001 | Fairfield, CT | 09001 | 916,829 | 9,200 | 7 | 7 | $0.070351 | $0.567708 | -0.906853 |
| NY-059 | Nassau, NY | 36059 | 1,339,532 | 13,400 | 7 | 7 | $0.076818 | $0.567708 | -0.868662 |
| NY-119 | Westchester, NY | 36119 | 949,113 | 9,500 | 7 | 7 | $0.084605 | $0.567708 | -0.826727 |
| CT-009 | New Haven, CT | 09009 | 862,477 | 8,600 | 7 | 7 | $0.084640 | $0.567708 | -0.826549 |
| NY-103 | Suffolk, NY | 36103 | 1,493,350 | 14,900 | 7 | 7 | $0.092945 | $0.567708 | -0.785897 |
| FL-099 | Palm Beach, FL | 12099 | 1,320,134 | 13,200 | 7 | 7 | $0.085613 | $0.437772 | -0.708711 |
| IL-043 | DuPage, IL | 17043 | 916,924 | 9,200 | 7 | 7 | $0.114677 | $0.474230 | -0.616513 |
| CA-013 | Contra Costa, CA | 06013 | 1,049,025 | 10,500 | 7 | 7 | $0.103154 | $0.376504 | -0.562283 |
| MA-017 | Middlesex, MA | 25017 | 1,503,085 | 15,000 | 7 | 7 | $0.112968 | $0.400321 | -0.549455 |
| FL-031 | Duval, FL | 12031 | 864,263 | 8,600 | 7 | 7 | $0.104019 | $0.351963 | -0.529383 |
| NJ-003 | Bergen, NJ | 34003 | 905,116 | 9,100 | 7 | 7 | $0.201201 | $0.567708 | -0.450495 |
| MD-031 | Montgomery, MD | 24031 | 971,777 | 9,700 | 7 | 7 | $0.166293 | $0.437184 | -0.419790 |
| CA-001 | Alameda, CA | 06001 | 1,510,271 | 15,100 | 7 | 7 | $0.165257 | $0.376504 | -0.357608 |
| NY-005 | Bronx, NY | 36005 | 1,385,108 | 13,900 | 7 | 7 | $0.265611 | $0.567708 | -0.329879 |
| MI-099 | Macomb, MI | 26099 | 840,978 | 8,400 | 7 | 7 | $0.166711 | $0.329251 | -0.295564 |
| CA-085 | Santa Clara, CA | 06085 | 1,781,642 | 17,800 | 7 | 7 | $0.199311 | $0.376504 | -0.276239 |
| WA-033 | King, WA | 53033 | 1,931,249 | 19,300 | 7 | 7 | $0.218615 | $0.405604 | -0.268422 |
| MI-125 | Oakland, MI | 26125 | 1,202,362 | 12,000 | 7 | 7 | $0.181809 | $0.329251 | -0.257912 |
| VA-059 | Fairfax, VA | 51059 | 1,081,726 | 10,800 | 7 | 7 | $0.242021 | $0.437184 | -0.256812 |
BONUS: Review Round by Round Bidding with Video Showing Change in Demand for Round 1 through Round 76:
Get Details on Selected Counties After Round
76:
Select Counties (multiple allowed)
Selected County Details
| County | County Name |
Census ID | Population | Supply | Aggregate Demand |
Posted Price |
Gross Proceeds |
Price Per MHz POP | Excess Demand |
Demand Change |
Predicted Price |
Overprice Ratio (Log Base10) |
|---|
